

The accompanying hypothetical production possibilities tables are for New Zealand and Spain. Each country can produce apples
Question:
The accompanying hypothetical production possibilities tables are for New Zealand and Spain. Each country can produce apples and plums. Plot the production possibilities data for each of the two countries separately. Referring to your graphs, answer the following: LO2
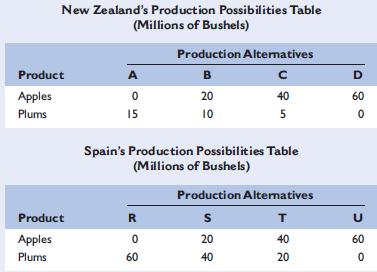
a. What is each country’s cost ratio of producing plums and apples?
b. Which nation should specialize in which product?
c. Show the trading possibilities lines for each nation if the actual terms of trade are 1 plum for 2 apples. (Plot these lines on your graph.)
d. Suppose the optimum product mixes before specialization and trade were alternative B in New Zealand and alternative S in Spain. What would be the gains from specialization and trade?
Step by Step Answer:

This question has not been answered yet.
You can Ask your question!

Economics Principles Problems And Policies
ISBN: 9780073511443
19th Edition
Authors: Campbell Mcconnell ,Stanley Brue ,Sean Flynn
