14 Draw a scatter diagram of the quantities of oil produced and petrol refined. Describe the relationship
Question:
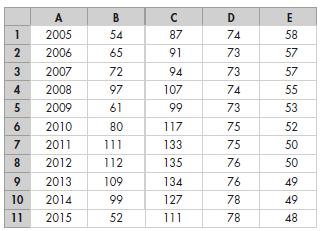
14 Draw a scatter diagram of the quantities of oil produced and petrol refined. Describe the relationship The spreadsheet provides data on oil and petrol: column A is the year, column B is the price of oil (dollars per barrel), column C is the price of petrol (pence per litre), column D is oil production and column E is the quantity of petrol refined (both in millions of barrels per day).

Fantastic news! We've Found the answer you've been seeking!
Step by Step Answer:
Related Book For 

Economics
ISBN: 9781118150122
10th European Edition
Authors: Michael Parkin, Dr Melanie Powell, Prof Kent Matthews
Question Posted:


