21 Draw a graph of the relationship between the price and the number of umbrellas purchased, holding
Question:
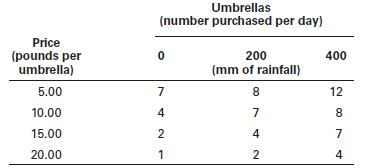
21 Draw a graph of the relationship between the price and the number of umbrellas purchased, holding the amount of rainfall constant at 200 mm. Describe the relationship.
The table gives the price of an umbrella, the amount of rainfall and the number of umbrellas purchased,

Fantastic news! We've Found the answer you've been seeking!
Step by Step Answer:
Related Book For 

Economics
ISBN: 9781118150122
10th European Edition
Authors: Michael Parkin, Dr Melanie Powell, Prof Kent Matthews
Question Posted:


