Use the following two graphs to answer the questions. a. Briefly explain which point on the Phillips
Question:
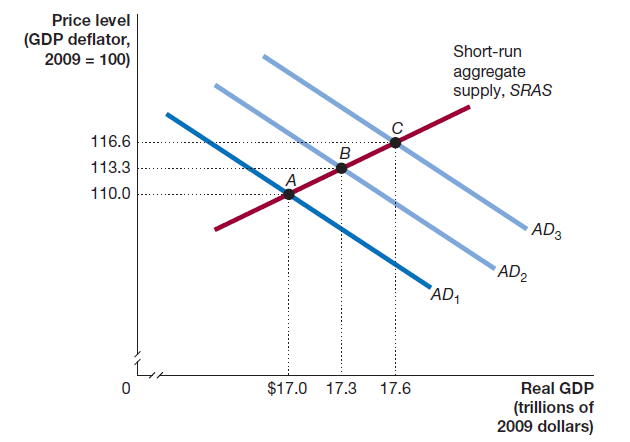
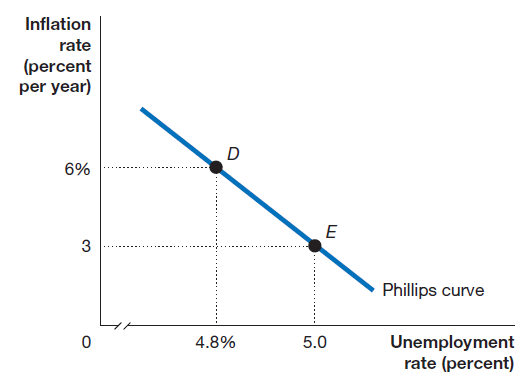
Use the following two graphs to answer the questions.


a. Briefly explain which point on the Phillips curve graph best represents the same economic situation as point B on the aggregate demand and aggregate supply graph.
b. Briefly explain which point on the Phillips curve graph best represents the same economic situation as point C on the aggregate demand and aggregate supply graph.
Transcribed Image Text:
Price level (GDP deflator, 2009 = 100) Short-run aggregate supply, SRAS 116.6 B. 113.3 110.0 AD3 * AD2 *AD1 $17.0 17.3 17.6 Real GDP (trillions of 2009 dollars) Inflation rate (percent per year) 3 Phillips curve 4.8% 5.0 Unemployment rate (percent)
Fantastic news! We've Found the answer you've been seeking!
Step by Step Answer:
Answer rating: 64% (17 reviews)
a Point E on the Phillips curve graph best represents the same econo...View the full answer

Answered By

Somshukla Chakraborty
I have a teaching experience of more than 4 years by now in diverse subjects like History,Geography,Political Science,Sociology,Business Enterprise,Economics,Environmental Management etc.I teach students from classes 9-12 and undergraduate students.I boards I handle are IB,IGCSE, state boards,ICSE, CBSE.I am passionate about teaching.Full satisfaction of the students is my main goal.
I have completed my graduation and master's in history from Jadavpur University Kolkata,India in 2012 and I have completed my B.Ed from the same University in 2013. I have taught in a reputed school of Kolkata (subjects-History,Geography,Civics,Political Science) from 2014-2016.I worked as a guest lecturer of history in a college of Kolkata for 2 years teaching students of 1st ,2nd and 3rd year. I taught Ancient and Modern Indian history there.I have taught in another school in Mohali,Punjab teaching students from classes 9-12.Presently I am working as an online tutor with concept tutors,Bangalore,India(Carve Niche Pvt.Ltd.) for the last 1year and also have been appointed as an online history tutor by Course Hero(California,U.S) and Vidyalai.com(Chennai,India).
4.00+
2+ Reviews
10+ Question Solved
Related Book For 

Question Posted:
Students also viewed these Business questions
-
Illustrate on the following two graphs the impact of increased consumer confidence. What direction did (a) The consumption function shift? (b) AD shift? C = a + bY 45 DISPOSABLE INCOME (OUTPUT)...
-
From the following two graphs, construct two graphs that depict the cost behavior on a per-square-foot basis for volumes ranging from 100,000 to 200,000 square feet. (Note that the Total Labor Cost...
-
From the following two graphs, construct two graphs that depict the cost behavior on a total cost basis for volumes ranging from 100,000 to 150,000 square feet. (Note that the Supplies Costs Per...
-
ABC Company produces and sells I product. Once the products are produced, they are sold, and there is no work-in- process, no any inventory in stock. Company uses standard costing method in its...
-
Consider the following alternatives: The analysis period is 10 years, but there will be no replacement for Alternative B at the end of 5 years. Based on a 15% interest rate, determine which...
-
What are mission objectives?
-
An order for 50 of a product is processed on work centers A and B. The setup time on A is 60 minutes, and run time is 5 minutes per piece. The setup time on B is 30 minutes, and the run time is 6...
-
Vail Resorts, Inc., owns and operates five premier year-round ski resort properties (Vail Mountain, Beaver Creek Resort, Breckenridge Mountain, and Keystone Resort, all located in the Colorado Rocky...
-
Remaining Time: 1 hour, 22 minutes, 20 seconds. Question Completion Status: Question 5 Use the data (a sample of 20 banks given Use the data la sample of 20 banks) given below to answer the following...
-
A survey of 1,700 shoppers asked, "Does social media influence your purchase decisions?" The results indicated that 20.3% of females responded that their purchase decisions are influenced by social...
-
Lael Brainard, a member of the Federal Reserves Board of Governors, delivered a speech in 2017 that included this observation: At a time when the unemployment rate has fallen from 8.2 percent to 4.4...
-
In its 2016 Annual Report, Toll Brothers noted, If mortgage interest rates increase significantly our revenues, gross margins, and net income could be adversely affected. a. Why might an increase in...
-
Find a parametrization c(t) of the line y = 5 2x such that c(0) = (2, 1).
-
1. What does the phrase "cost of quality" mean? How might using this statement assist a company in addressing its quality issues? 2. What key distinctions exist between total quality human resource...
-
Does productivity in terms of output per labor our insure a company will be profitable? Why or why not? What questions should be asked to test whether productivity has increased? How do these answers...
-
How do the four Ps of marketing (product, price, promotion, place) differ in international markets?
-
Do you agree with the societal or political forces? Why or why not? Support your assertions with credible sources
-
How do the global transformational leadership models comprise a work environment that sees the need for change and embraces the new changes?Explain
-
Peterson Industries has three potential projects it could invest in for the coming year. Finances are tight, so it needs to choose the projects with the greatest benefit for the company. The companys...
-
Identify the source of funds within Micro Credit? How does this differ from traditional sources of financing? What internal and external governance mechanisms are in place in Micro Credit?
-
The treasurer of a firm noted that many invoices were received with the following terms of payment: "20/0- 10 days, net 30 days". Thus, if he were to pay the bill within 10 days of its date, he could...
-
In 1555, King Henry borrowed money from his bankers on the condition that he pay 5% of the loan at each fair (there were four fairs per year) until he had made 40 payments. At that time the loan...
-
One of the largest automobile dealers in the city advertises a 3-year-old car for sale as follows: Cash price $3575, or a down payment of $375 with 45 monthly payments of $93.41. Susan DeVaux bought...
-
Bass Accounting Services expects its accountants to work a total of 26,000 direct labor hours per year. The company's estimated total indirect costs are $ 260,000. The company uses direct labor hours...
-
The Balance Sheet has accounts where the accountant must make estimates. Some situations in which estimates affect amounts reported in the balance sheet include: Allowance for doubtful accounts....
-
Alado fis istirmerfs Tat likifond 205L [ridont inip lanod whadtinion? hingend is antan Qultit foer avdeed Divdasit errem yodichiders Etexlpoges Getmare nelp

Study smarter with the SolutionInn App


