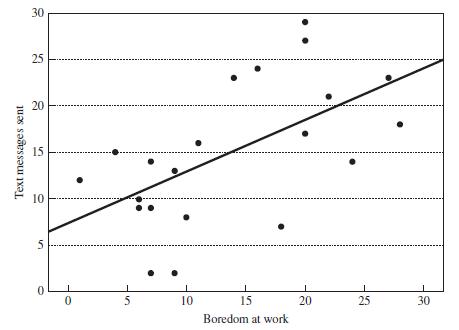
In the following graph, what type of correlation is depicted? a. Positive, strong b. Positive, moderate c.
Question:
In the following graph, what type of correlation is depicted?

a. Positive, strong
b. Positive, moderate
c. Negative, strong
d. Negative, weak
Transcribed Image Text:
Text messages sent ce 30 25 20 15 10 5 0 0 5 10 15 Boredom at work 20 25 30
Fantastic news! We've Found the answer you've been seeking!
Step by Step Answer:
Answer rating: 60% (10 reviews)
b Positive moderate Positive moderate correlation refers to a relationship between two variables whe...View the full answer

Answered By

Kenneth Mutia
I have a B.S. in Statistics from the Jomo Kenyatta University of Agriculture and technology. I have been an academic tutor for over 3 years. I have a passion for helping students reach their full potential and am dedicated to helping them succeed. I am patient and adaptable, and I have experience working with students of all ages and abilities, from elementary school to college in their various fields. I have a wide scope of diverse tutoring experience in several courses of study with significant success as a tutor.
0.00
0 Reviews
10+ Question Solved
Related Book For 

Elementary Statistics In Social Research
ISBN: 9780205845484
12th Edition
Authors: Jack A. Levin, James Alan Fox, David R. Forde
Question Posted:
Students also viewed these Statistics questions
-
In the following graph, what type of correlation is depicted? a. Positive, strong b. Positive, weak c. Negative, strong d. Negative, weak Text messages sent 30...
-
In the following graph, what type of correlation is depicted? a. Positive, strong b. Positive, moderate c. Negative, strong d. Negative, moderate Text messages sent 30 25 20 15 10 5 0 0 5 10 15...
-
The shaded area in the following graph represents the feasible region of a linear programming problem whose objective function is to be maximized. Label each of the following statements as True or...
-
TH, has two electrons in 3) o Accodng ery, a moleule 4) o Hydrogen bondd is 2) A weak electrostatic force 4) It is not a bond 1)A weak covaient bund 3) A weak metallic force 11. Bydrogen bond may 1)...
-
Do you see any potential EEO issues that should be considered at CompTech? Explain your answer with as much detail as possible.
-
Name the two alternatives to the Douglas-Peucker algorithm for line generalization in ArcGIS.
-
High school academic rank. Select a first-year college student at random and ask what his or her academic rank was in high school. Here are the probabilities, based on proportions from a large sample...
-
The R. M. Smithers Corporation earned an operating profit margin of 10 percent based on sales of $10 million and total assets of $5 million last year. a. What was Smithers total asset turnover ratio?...
-
The Southern Division manager of Texcaliber Inc. is growing concerned that the division will not be able to meet its current period income objectives. The division uses absorption costing for...
-
Evaluate the expression. 4 C 3 / 10 C 3
-
A correlation coefficient expresses in a single number a. The strength of a correlation. b. The direction of a correlation. c. Both the strength and the direction of a correlation. d. None of the...
-
Using the General Social Survey, calculate Pearsons r to test the following null hypotheses: a. Create the correlation matrix. b. Report the strength and direction of the Pearsons r correlation...
-
The sales price of an item is \(\$ 38.50\) after a \(40 \%\) discount. What was the retail price of the item? Round to the nearest penny.
-
What is brand awareness for Jam & Daisies ? their leaning advantage, consideration advantage, choice advantages? 5. what is the recommendation of brand awareness? 6. What is Brand recognition? 7....
-
On August 1st, Custom Car Co's work in process inventory was $24900; its raw materials inventory was $6000; manufacturing overhead had a $1800 debit balance. Work in Process Subsidiary Data 8/1:...
-
Case: Castoro & Partners, CPAs is auditing Cloud 9 for the FY2023. Cloud 9 is a small public company and has been an audit client of Castoro & Partners since 2018. Materiality Methodology: Overall...
-
1)Solve the following differential equations by Undetermined Coefficient Method. dy dx dy - 4- 4+ 4y = 16x2e2x dx
-
Every year Monty Industries manufactures 8,600 units of part 231 for use in its production cycle. The per unit costs of part 231 are as follows: Direct materials Direct labor Variable manufacturing...
-
A port and a radar station are 2 mi apart on a straight shore running east and west see figure). A ship leaves the port at noon traveling northeast at a rate of 15 mi/hr. If the ship maintains its...
-
Q1) What is the a3 Value Q2) What is the a7 Value Q3) What is the a4 Value Q4) What is the b3 Value Q5) What is the b2 Value Q6) What is the sign of 2nd constraint? A pastry chef at a bakery wants to...
-
When two events are not mutually exclusive, P(A or B) = P(A) + P(B).
-
At a particular fitness center, 64.1% of the members take at least one class, 18.6% work with a personal trainer, and 9.2% do both. If a member of the center is selected at random, what is the...
-
Consider the U.S. Senate. Find out about the composition of any three of the Senates standing committees. How many different committees of Senators are possible, knowing the party composition of the...
-
3. The nominal interest rate compounded monthly when your $7,000 becomes $11,700 in eight years is ________
-
An investor can design a risky portfolio based on two stocks, A and B. Stock A has an expected return of 21% and a standard deviation of return of 39%. Stock B has an expected return of 14% and a...
-
Advanced Small Business Certifica Drag and Drop the highlighted items into the correct boxes depending on whether they increase or decrease Alex's stock basis. Note your answers- you'll need them for...

Study smarter with the SolutionInn App


