

Question: P 2 Use the Standard Normal Table or technology to find the z-score that corresponds to the cumulative area or percentile. Table 4-Standard Normal
P2
Use the Standard Normal Table or technology to find the z-score that corresponds to the cumulative area or percentile.
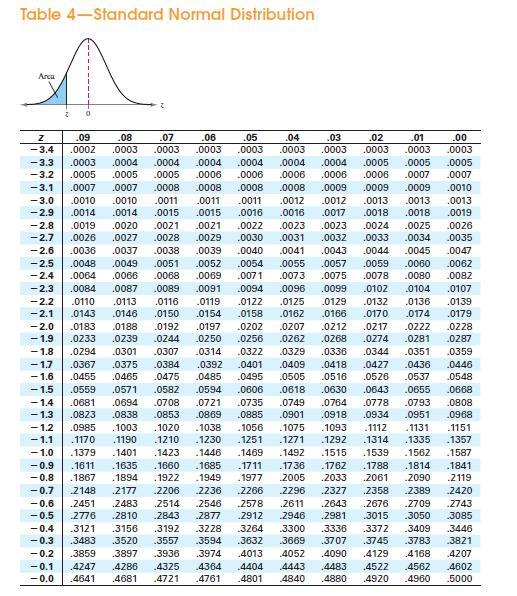
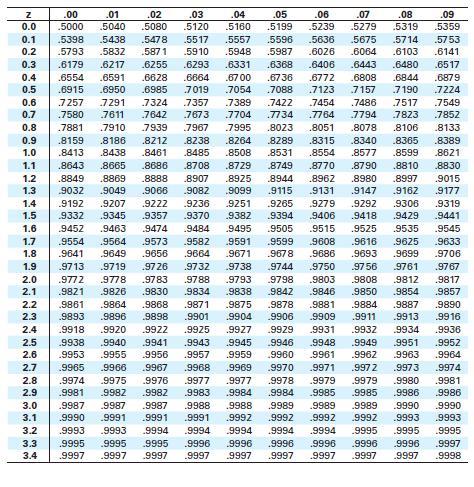
Table 4-Standard Normal Distribution Arca 0 z Z .09 .08 .07 .06 .05 .04 .03 .02 .01 .00 -3.4 .0002 .0003 .0003 .0003 .0003 .0003 .0003 .0003 .0003 .0003 -3.3 .0003 .0004 .0004 .0004 .0004 .0004 .0004 .0005 .0005 .0005 -3.2 .0005 .0005 .0005 .0006 .0006 .0006 .0006 .0006 .0007 .0007 -3.1 .0007 .0007 .0008 .0008 .0008 .0008 .0009 .0009 .0009 .0010 -3.0 .0010 .0010 .0011 .0011 .0011 .0012 .0012 .0013 .0013 .0013 -2.9 .0014 .0014 .0015 .0015 .0016 .0016 .0017 .0018 .0018 .0019 -2.8 .0019 .0020 .0021 .0021 .0022 .0023 .0023 .0024 .0025 .0026 -2.7 .0026 .0027 .0028 .0029 .0030 .0031 .0032 .0033 .0034 .0035 -2.6 .0036 .0037 .0038 .0039 .0040 .0041 .0043 .0044 .0045 .0047 -2.5 .0048 -2.4 .0064 .0066 .0049 .0051 .0052 .0054 .0055 .0057 .0059 .0060 .0062 .0068 .0069 .007 1 .0073 .0075 .0078 .0080 .0082 -2.3 .0084 .0087 .0089 .0091 .0094 .0096 .0099 .0102 0104 .0107 -2.2 .0110 .0113 0116 .0119 .0122 .0125 .0129 .0132 .0136 .0139 -2.1 .0143 0146 0150 .0154 .0158 .0162 .0166 .0170 .0174 .0179 -2.0 .0183 .0188 .0192 .0197 .0202 .0207 .0212 .0217 .022Z .0228 -1.9 .0233 .0239 .0244 .0250 .0256 .0262 .0268 .0274 .0281 .0287 -1.8 .0294 .0301 .0307 0314 .0322 .0329 .0336 .0344 .0351 .0359 -1.7 .0367 .0375 .0384 .0392 .0401 .0409 -1.6 .0455 .0465 .0475 .0485 .0495 .0505 .0418 .0427 .0436 .0446 .0516 .0526 .0537 .0548 -1.5 .0559 .0571 .0582 .0594 .0606 .0618 .0630 .0643 .0655 .0668 -1.4 .0681 .0694 .0708 .0721 .0735 -1.3 .0823 .0838 .0853 .0869 0885 .0749 .0764 .0901 .0778 .0793 .0808 .0918 .0934 .0951 .0968 -1.2 .0985 .1003 1020 -1.1 .1170 .1210 -1.0 .1379 .1401 .1423 -0.9 .1611 .1635 .1660 .1038 .1056 .1075 .1093 .1112 .1131 .1151 .1190 .1230 .1251 .1271 .1446 .1469 .1492 .1685 .1711 .1736 .1292 .1314 .1515 .1539 .1762 .1788 .1335 .1357 .1562 .1587 .1814 .1841 -0.8 .1867 .1894 .1922 .1949 .1977 2005 -0.7 2148 .2177 -0.6 .2451 .2483 .2514 -0.5 .2776 -0.4 .3121 -0.3 .3483 -0.2 .3859 .3897 -0.1 .4247 .4286 -0.0 .4641 .4681 .2206 .2236 .2266 .2546 .2810 .2843 .3156 .3192 .3520 .3557 .2578 .2877 .2912 .3228 .3264 .3594 .3632 .3936 .3974 .4325 .4364 .4721 .4761 .2033 2061 2296 .2327 .2358 .2611 .2643 2676 .2709 2946 .2981 .3015 .3050 3085 .3300 .3336 .3372 .3409 .3446 .3669 .3707 .3745 .3783 .3821 .4013 .4052 .4090 .4129 4168 .4207 .4404 4443 .4483 .4522 .4562 .4602 4801 4840 .4880 .4920 .4960 -5000 .2090 2119 .2389 .2420 .2743
Step by Step Solution
There are 3 Steps involved in it

Get step-by-step solutions from verified subject matter experts