P 20 Use the Standard Normal Table or technology to find the z-score that corresponds to the
Question:
P20
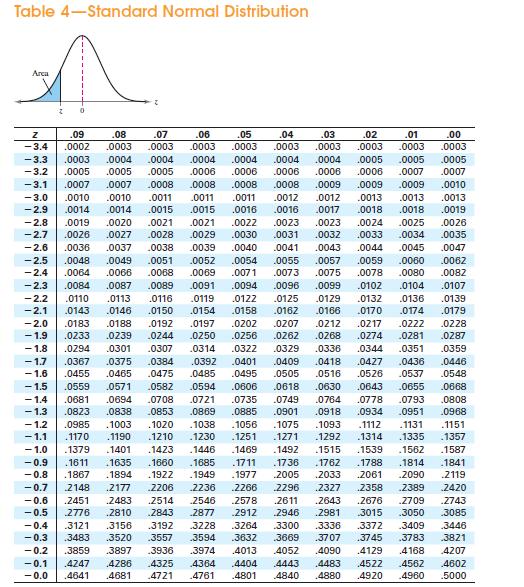
Use the Standard Normal Table or technology to find the z-score that corresponds to the cumulative area or percentile.
Transcribed Image Text:
Table 4-Standard Normal Distribution Arca Z 0 Z .09 .08 .07 .06 .05 .04 .03 .02 .01 .00 -3.4 .0002 .0003 .0003 .0003 .0003 .0003 .0003 .0003 .0003 .0003 -3.3 .0003 .0004 .0004 .0004 .0004 .0004 .0004 .0005 .0005 .0005 -3.2 .0005 .0005 .0005 .0006 .0006 .0006 .0006 -3.1 .0007 .0007 .0008 .0008 .0008 .0008 -3.0 .0010 .0010 .0011 .0011 .0011 .0012 -2.9 -2.3 .0084 .0087 .0014 .0014 -2.8 .0019 .0020 .0021 -2.7 .0026 .0027 .0028 -2.6 .0036 .0037 .0038 -2.5 .0048 .0049 .0051 -2.4 .0064 .0066 .0068 .0089 .0015 .0015 .0016 .0021 .0029 .0009 .0012 .0013 .0013 .0013 .0016 .0017 .0018 .0018 .0019 .0022 .0023 .0023 .0024 .0025 .0026 .0030 .0031 .0032 .0033 .0034 .0035 .0039 .0040 .0041 .0043 .0044 .0052 .0054 .0055 .0057 .0059 .0069 .0071 .0073 .0075 .0078 .0091 .0094 .0096 .0099 .0006 .0007 .0007 .0009 .0009 .0010 .0045 .0047 .0060 .0062 .0080 .0082 .0102 .0104 .0107 -2.2 -2.1 0110 .0143 .0146 .0113 .0116 .0119 .0122 .0125 .0129 .0132 .0136 .0139 .0150 .0154 .0158 .0162 .0166 .0170 .0174 .0179 -2.0 .0183 0188 .0192 .0197 .0202 .0207 .0212 -1.9 .0233 .0239 .0244 .0250 .0256 .0262 .0217 .0268 .0274 .022Z .0228 -1.8 .0294 .0301 .0307 .0314 .0322 .0329 .0336 .0281 .0344 .0351 .0287 .0359 -1.7 .0367 .0375 .0384 .0392 .0401 .0409 .0418 .0427 .0436 .0446 1.6 .0455 .0465 .0475 .0485 .0495 .0505 -1.5 .0559 .0571 .0582 .0594 .0606 .0618 .0516 .0526 .0537 .0630 .0643 .0655 .0548 .0668 1.4 .0681 .0694 .0708 .0721 .0735 1.3 .0823 .0838 1.2 .0985 .1003 -1.1 .1170 .1190 -1.0 .1379 .1401 -0.9 .1611 .1635 -0.8 .1867 .1894 .0853 .0869 .0885 -0.7 2148 .2177 .0918 .0934 .1020 .1038 .1093 .1112 .1210 .1230 .1251 .1271 .1292 .1314 .1423 .1446 .1469 .1492 .1515 .1539 .1660 .1685 .1711 .1736 .1762 .1788 .1814 .1922 .1949 .1977 .2005 .2033 .2061 .2090 .2206 2236 .2266 2296 .2327 2358 .2389 .2420 -0.6 .2451 .2483 .2514 .2546 .2578 .2611 .2643 .2676 .2709 .2743 0.5 2776 .2810 .2843 .2877 .2912 .2946 .2981 3015 .3050 .3085 -0.4 .3121 .3156 .3192 3228 .3264 .3300 .3336 .3372 .3409 -0.3 .3483 .3520 .3557 3594 .3632 .3669 .3707 .3745 .3783 -0.2 .3859 .3897 .3936 .3974 .4013 .4052 .4090 .4129 .4168 -0.1 .4247 .4286 .4325 .4364 .4404 .4443 .4483 .4522 .4562 .4602 -0.0 .4641 .4681 .4721 .4761 .4801 4840 .4880 .4920 .4960 .5000 .0749 .0764 0778 .0793 .0901 .1056 .1075 .0808 .0951 0968 .1131 .1151 .1335 .1357 .1562 .1587 .1841 2119 3446 .3821 4207
Fantastic news! We've Found the answer you've been seeking!
Step by Step Answer:
Answer rating: 100% (1 review)
Answered By
Chiranjib Thakur
I have no tutoring experience yet, but I can share my skills and knowledge gained from my education and work experiences. I have been a CPA since 2012 with 6 years of work experience in internal auditing and 4 years of work experience in accounting at the supervisory level.
5.00+
1+ Reviews
10+ Question Solved
Related Book For
Elementary Statistics Picturing The World
ISBN: 9781292260464
7th Global Edition
Authors: Betsy Farber, Ron Larson
Question Posted:
Students also viewed these Statistics questions
-
0.993 Use the Standard Normal Table or technology to find the z-score that corresponds to the cumulative area or percentile. Table 4-Standard Normal Distribution Arca z 0 z Z .09 .08 .07 .06 .05 .04...
-
P 46 Use the Standard Normal Table or technology to find the z-score that corresponds to the cumulative area or percentile. Table 4-Standard Normal Distribution Arca 0 z Z .09 .08 .07 .06 .05 .04...
-
P 67 Use the Standard Normal Table or technology to find the z-score that corresponds to the cumulative area or percentile. Table 4-Standard Normal Distribution Arca 0 z Z .09 .08 .07 .06 .05 .04 .03...
-
Assume that n is a positive integer. For each of the following algorithm segments, how many times will the innermost loop be iterated when the algorithm segment is implemented and run? 1) for k:=1 to...
-
Identify the ethical issues that arise from the facts of the case. How do you assess stakeholder responsibilities?
-
Compare and contrast the three major ways economies can be organized. What type of economy exists in the United States? Do you think another type of economy would be better? Explain your answer.
-
Emergency Savings The table shows the results of a survey in which 142 male and 145 female workers ages 25 to 64 were asked if they had at least one months income set aside for emergencies. (a) Find...
-
Ashley runs a small business in Boulder, Colorado, that makes snow skis. She expects the business to grow substantially over the next three years. Because she is concerned about product liability and...
-
exam pless Mohammed company is well established company in Sultanate Of Oman. They are interested in calculating goodwill in average profit methods, super profit method and capitalization method by...
-
P 45 Use the Standard Normal Table or technology to find the z-score that corresponds to the cumulative area or percentile. Table 4-Standard Normal Distribution Arca Z 0 Z .09 .08 .07 .06 .05 .04 .03...
-
0.0156 Use the Standard Normal Table or technology to find the z-score that corresponds to the cumulative area or percentile. Table 4-Standard Normal Distribution Arca Z 0 Z .09 .08 .07 .06 .05 .04...
-
Jarvis Jackets Ltd has decided to extend its range to include denim jackets. One jacket requires a standard usage of 3 metres of direct materials which has been set at a standard price of 2.20 per...
-
1. Write short notes on Discrete Cosine Transform (DCT) 2. Describe Fast Fourier Transform 3. Write short notes on the Hotelling transform
-
1Explain Discrete Fourier Transform in detail. 2. Explain the Properties of 2D discrete Fourier Transform 3. Discuss Hadamard's transformation in detail
-
1. Specify the objective of image enhancement technique. 2. List the 2 categories of image enhancement. 3. What is the purpose of image averaging? 4. What is meant by masking? 5. Define histogram.
-
6. What is meant by histogram equalization? 7. Differentiate linear spatial filter and non-linear spatial filter. 8. Give the mask used for high boost filtering. 9. What is meant by a laplacian...
-
11. What do you mean by Point processing? 12. Define Derivative filter? 13. Define spatial filtering 14. What is a Median filter? 15. What is maximum filter and minimum filter? 16. Write the...
-
Determine the value of each of the following binomial co-efficients a. b. c. d. 10
-
Name some of the various types of financial intermediaries described in the chapter and indicate the primary reason(s) each was created.
-
Berbice Inc. has a new project, and you were recruitment to perform their sensitivity analysis based on the estimates of done by their engineering department (there are no taxes): Pessimistic Most...
-
#3) Seven years ago, Crane Corporation issued 20-year bonds that had a $1,000 face value, paid interest annually, and had a coupon rate of 8 percent. If the market rate of interest is 4.0 percent...
-
I have a portfolio of two stocks. The weights are 60% and 40% respectively, the volatilities are both 20%, while the correlation of returns is 100%. The volatility of my portfolio is A. 4% B. 14.4%...
Wileyplus V5 Card For Financial And Managerial Accounting 1st Edition - ISBN: 1118277295 - Free Book
Study smarter with the SolutionInn App