P 8 Use the Standard Normal Table or technology to find the z-score that corresponds to the
Question:
P8
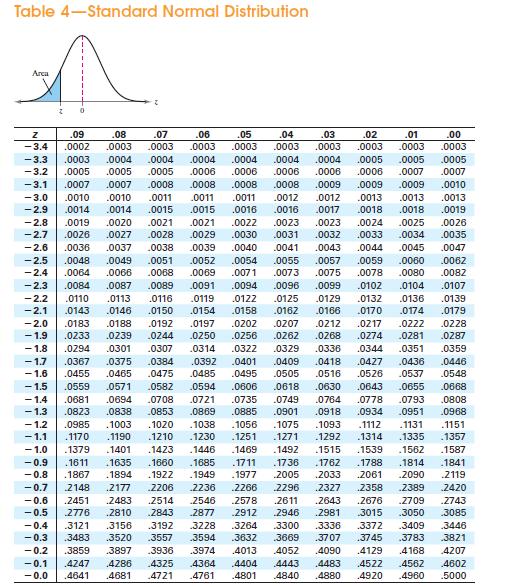
Use the Standard Normal Table or technology to find the z-score that corresponds to the cumulative area or percentile.
Transcribed Image Text:
Table 4-Standard Normal Distribution Arca Z 0 Z .09 .08 .07 .06 .05 .04 .03 .02 .01 .00 -3.4 .0002 .0003 .0003 .0003 .0003 .0003 .0003 .0003 .0003 .0003 -3.3 .0003 .0004 .0004 .0004 .0004 .0004 .0004 .0005 .0005 .0005 -3.2 .0005 .0005 .0005 .0006 .0006 .0006 .0006 -3.1 .0007 .0007 .0008 .0008 .0008 .0008 -3.0 .0010 .0010 .0011 .0011 .0011 .0012 -2.9 -2.3 .0084 .0087 .0014 .0014 -2.8 .0019 .0020 .0021 -2.7 .0026 .0027 .0028 -2.6 .0036 .0037 .0038 -2.5 .0048 .0049 .0051 -2.4 .0064 .0066 .0068 .0089 .0015 .0015 .0016 .0021 .0029 .0009 .0012 .0013 .0013 .0013 .0016 .0017 .0018 .0018 .0019 .0022 .0023 .0023 .0024 .0025 .0026 .0030 .0031 .0032 .0033 .0034 .0035 .0039 .0040 .0041 .0043 .0044 .0052 .0054 .0055 .0057 .0059 .0069 .0071 .0073 .0075 .0078 .0091 .0094 .0096 .0099 .0006 .0007 .0007 .0009 .0009 .0010 .0045 .0047 .0060 .0062 .0080 .0082 .0102 .0104 .0107 -2.2 -2.1 0110 .0143 .0146 .0113 .0116 .0119 .0122 .0125 .0129 .0132 .0136 .0139 .0150 .0154 .0158 .0162 .0166 .0170 .0174 .0179 -2.0 .0183 0188 .0192 .0197 .0202 .0207 .0212 -1.9 .0233 .0239 .0244 .0250 .0256 .0262 .0217 .0268 .0274 .022Z .0228 -1.8 .0294 .0301 .0307 .0314 .0322 .0329 .0336 .0281 .0344 .0351 .0287 .0359 -1.7 .0367 .0375 .0384 .0392 .0401 .0409 .0418 .0427 .0436 .0446 1.6 .0455 .0465 .0475 .0485 .0495 .0505 -1.5 .0559 .0571 .0582 .0594 .0606 .0618 .0516 .0526 .0537 .0630 .0643 .0655 .0548 .0668 1.4 .0681 .0694 .0708 .0721 .0735 .0853 .0869 .0885 1.3 .0823 .0838 .0918 .0934 1.2 .0985 .1003 .1020 .1038 .1093 .1112 -1.1 .1170 .1190 .1210 .1230 .1251 .1271 .1292 .1314 -1.0 .1379 .1401 .1423 .1446 .1469 .1492 .1515 .1539 -0.9 .1611 .1635 .1660 .1685 .1711 .1736 .1762 .1788 .1814 -0.8 .1867 .1894 .1922 .1949 .1977 .2005 .2033 .2061 .2090 -0.7 2148 .2177 .2206 2236 .2266 2296 .2327 2358 .2389 .2420 -0.6 .2451 .2483 .2514 .2546 .2578 .2611 .2643 .2676 .2709 .2743 0.5 2776 .2810 .2843 .2877 .2912 .2946 .2981 3015 .3050 .3085 -0.4 .3121 .3156 .3192 3228 .3264 .3300 .3336 .3372 .3409 -0.3 .3483 .3520 .3557 3594 .3632 .3669 .3707 .3745 .3783 -0.2 .3859 .3897 .3936 .3974 .4013 .4052 .4090 .4129 .4168 -0.1 .4247 .4286 .4325 .4364 .4404 .4443 .4483 .4522 .4562 .4602 -0.0 .4641 .4681 .4721 .4761 .4801 4840 .4880 .4920 .4960 .5000 .0749 .0764 0778 .0793 .0901 .1056 .1075 .0808 .0951 0968 .1131 .1151 .1335 .1357 .1562 .1587 .1841 2119 3446 .3821 4207
Fantastic news! We've Found the answer you've been seeking!
Step by Step Answer:
Answer rating: 100% (QA)
Answered By
Anum Naz
Lecturer and researcher with 10+ years of experience teaching courses in both undergraduate and postgraduate levels. Supervised 17 BA theses, 07 MA theses, and 1 Ph.D. dissertations. Edited and co-authored 2 monographs on contemporary trends in political thought. Published over articles in peer-reviewed journals.
4.80+
11+ Reviews
52+ Question Solved
Related Book For
Elementary Statistics Picturing The World
ISBN: 9781292260464
7th Global Edition
Authors: Betsy Farber, Ron Larson
Question Posted:
Students also viewed these Statistics questions
-
0.993 Use the Standard Normal Table or technology to find the z-score that corresponds to the cumulative area or percentile. Table 4-Standard Normal Distribution Arca z 0 z Z .09 .08 .07 .06 .05 .04...
-
P 46 Use the Standard Normal Table or technology to find the z-score that corresponds to the cumulative area or percentile. Table 4-Standard Normal Distribution Arca 0 z Z .09 .08 .07 .06 .05 .04...
-
P 67 Use the Standard Normal Table or technology to find the z-score that corresponds to the cumulative area or percentile. Table 4-Standard Normal Distribution Arca 0 z Z .09 .08 .07 .06 .05 .04 .03...
-
Given that log (2) 0.91 and log (5) 2.1, evaluate each of the following. Hint: use the properties of logarithms to rewrite the given logarithm in terms of the the logarithms of 2 and 5. a) log(0.4)~...
-
Throughout The Parable of the Sadhu, Bowen McCoy refers to the breakdown between the individual and corporate ethic. Explain what he meant by that and how, if we view the hikers on the trek up the...
-
The corporate charter of Letterman Corporation allows the issuance of a maximum of 100,000 shares of common stock. During its first two years of operations, Letterman sold 60,000 shares to...
-
Computers and Internet Access A study found that 81% of households in the United States have computers. Of those 81%, 92% have Internet access. Find the probability that a U.S. household selected at...
-
In Section 5.5, we showed the following two-person, zero-sum game had a mixed strategy: a. Use dominance to reduce the game to a 2 2 game. Which strategies are dominated? b. Determine the optimal...
-
Trini Company set the following standard costs per unit for its single product. Direct materials (30 pounds @ $4 per pound) $ 120.00 Direct labor (5 hours @ $14 per hour) 70.00 Variable overhead (5...
-
P 46 Use the Standard Normal Table or technology to find the z-score that corresponds to the cumulative area or percentile. Table 4-Standard Normal Distribution Arca Z 0 Z .09 .08 .07 .06 .05 .04 .03...
-
P 70 Use the Standard Normal Table or technology to find the z-score that corresponds to the cumulative area or percentile. Table 4-Standard Normal Distribution Arca Z 0 Z .09 .08 .07 .06 .05 .04 .03...
-
If f is a continuous function, what is the limit as h 0 of the average value of f on the interval [x, x + h]?
-
A Ltd. is preparing its cash budget for the period. Sales are expected to be ` 1,00,000 in April 2015, `2,00,000 in May 2015, ` 3,00,000 in June 2015 and ` 1,00,000 in July 2015. Half of all sales...
-
A Company Operates throughput accounting system. The details of product A per unit are as under: Selling price `40 Material Cost `10 Conversion Cost `15 Time on Bottleneck resources 10 minutes What...
-
n = 5, p = 0.6, P(X = 3) a. The binomial probability formula, Formula 5.4 Round your probability answers to three decimal places. b. Table VII in Appendix A. Compare your answer here to that in part...
-
Explain five different cases of income exempt from tax with clear examples.
-
Los datos de la columna C tienen caracteres no imprimibles antes y despus de los datos contenidos en cada celda. En la celda G2, ingrese una frmula para eliminar cualquier carcter no imprimible de la...
-
Explain impacts of changing FIFO method to weighted average method in inventory cost valuations? Explain impacts of changing Weighted average method to FIFO method in inventory cost valuations?...
-
A perpetuity makes payments starting five years from today. The first payment is 1000 and each payment thereafter increases by k (in %) (which is less than the effective annual interest rate) per...
Study smarter with the SolutionInn App