

The responses of 1500 U.S. adults to a survey that asked them to state their own political
Question:
The responses of 1500 U.S. adults to a survey that asked them to state their own political viewpoints are shown in the Pareto chart. Find the probability of each event.
(a) Randomly selecting a person from the sample who does not consider themselves liberal or very liberal
(b) Randomly selecting a person from the sample who is conservative or very conservative
(c) Randomly selecting a person from the sample who is not very liberal or very conservative
(d) Randomly selecting a person from the sample who is either unsure or moderate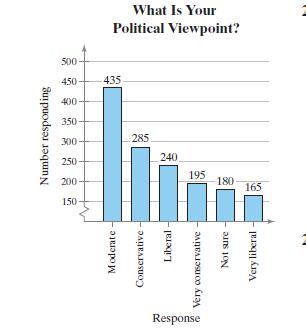
Fantastic news! We've Found the answer you've been seeking!
Step by Step Answer:

Answered By
Utsab mitra
I have the expertise to deliver these subjects to college and higher-level students. The services would involve only solving assignments, homework help, and others.
I have experience in delivering these subjects for the last 6 years on a freelancing basis in different companies around the globe. I am CMA certified and CGMA UK. I have professional experience of 18 years in the industry involved in the manufacturing company and IT implementation experience of over 12 years.
I have delivered this help to students effortlessly, which is essential to give the students a good grade in their studies.
2+ Reviews
10+ Question Solved
Related Book For 
Question Posted:
