

Question: Find the range of the data set represented by the graph. Median Annual Income by State 12 40 45 50 55 60 65 70 75
Find the range of the data set represented by the graph.
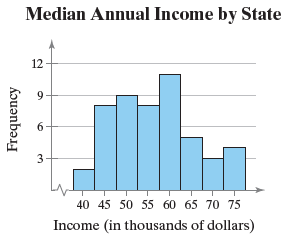
Median Annual Income by State 12 40 45 50 55 60 65 70 75 Income (in thousands of dollars) Frequency 3.
Step by Step Solution
★★★★★
3.33 Rating (168 Votes )
There are 3 Steps involved in it
1 Expert Approved Answer
Step: 1 Unlock

Range Max ... View full answer
Question Has Been Solved by an Expert!
Get step-by-step solutions from verified subject matter experts
Step: 2 Unlock
Step: 3 Unlock