

Question: Listed below are baseball team statistics consisting of the proportions of wins and the result of this difference: Difference = (number of runs scored) -
Listed below are baseball team statistics consisting of the proportions of wins and the result of this difference: Difference = (number of runs scored) - (number of runs allowed). The statistics are from a recent year, and the teams are NY (Yankees), Toronto, Boston, Cleveland, Texas, Houston, San Francisco, and Kansas City. Is there sufficient evidence to conclude that there is a linear correlation between the proportion of wins and the above difference?
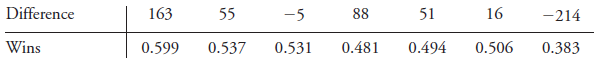
Construct a scatterplot, find the value of the linear correlation coefficient r, and find the critical values of r from Table A-6 using ? = 0.05. Determine whether there is sufficient evidence to support a claim of a linear correlation between the two variables.
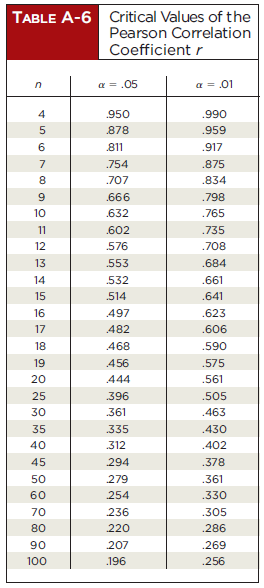
Difference Wins 163 55 -5 88 51 0.599 0.537 0.531 0.481 0.494 16 0.506 -214 0.383 TABLE A-6 Critical Values of the Pearson Correlation Coefficient r n TELEFONNING 4 5 6 7 8 9 10 11 12 13 14 15 16 17 18 19 20 25 30 35 40 45 50 60 70 80 90 100 = .05 .950 .878 811 .754 .707 .666 .632 .602 576 .553 .532 .514 .497 482 468 .456 444 .396 .361 .335 312 294 279 254 236 220 207 .196 a = .01 .990 .959 .917 .875 .834 .798 .765 .735 .708 .684 .661 .641 .623 .606 .590 .575 .561 .505 .463 .430 .402 .378 .361 .330 .305 286 .269 .256
Step by Step Solution
3.37 Rating (169 Votes )
There are 3 Steps involved in it
No there is not sufficient evidence to conclude that there ... View full answer

Get step-by-step solutions from verified subject matter experts