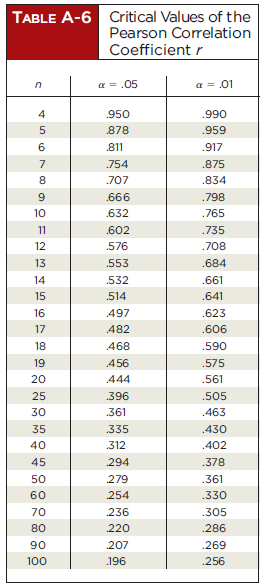
Listed below are prices (in dollars) and quality rating scores of rear-projection televisions (based on data from
Question:
Listed below are prices (in dollars) and quality rating scores of rear-projection televisions (based on data from Consumer Reports). All of the televisions have screen sizes of 55 in. or 56 in. Is there sufficient evidence to conclude that there is a linear correlation between the price and the quality rating score of rear-projection televisions? Does it appear that as the price increases, the quality score also increases? Do the results suggest that as you pay more, you get better quality?

Construct a scatterplot, find the value of the linear correlation coefficient r, and find the critical values of r from Table A-6 using ? = 0.05. Determine whether there is sufficient evidence to support a claim of a linear correlation between the two variables.?

Step by Step Answer:


