The percent of college students marijuana use for a sample of 95,761 students is shown in the
Question:
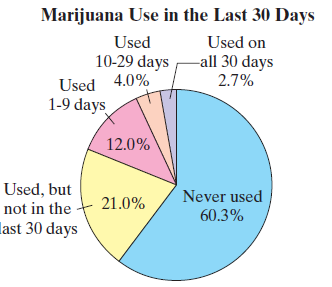
The percent of college students’ marijuana use for a sample of 95,761 students is shown in the pie chart. Find the probability of each event.
(a) Randomly selecting a student who never used marijuana.
(b) Randomly selecting a student who used marijuana.
(c) Randomly selecting a student who used marijuana between 1 and 29 of the last 30 days.
(d) Randomly selecting a student who used marijuana on at least 1 of the last 30 days.
Transcribed Image Text:
Marijuana Use in the Last 30 Days Used Used on 10-29 days 4.0% 1-9 days -all 30 days 2.7% Used 12.0% Used, but not in the Never used 21.0% 60.3% last 30 days
Fantastic news! We've Found the answer you've been seeking!
Step by Step Answer:
Answer rating: 53% (13 reviews)
a Pnever used 0603 b Pused 1 Pnever used 1 ...View the full answer
Answered By
Utsab mitra
I have the expertise to deliver these subjects to college and higher-level students. The services would involve only solving assignments, homework help, and others.
I have experience in delivering these subjects for the last 6 years on a freelancing basis in different companies around the globe. I am CMA certified and CGMA UK. I have professional experience of 18 years in the industry involved in the manufacturing company and IT implementation experience of over 12 years.
I have delivered this help to students effortlessly, which is essential to give the students a good grade in their studies.
3.50+
2+ Reviews
10+ Question Solved
Related Book For
Elementary Statistics Picturing The World
ISBN: 9780134683416
7th Edition
Authors: Ron Larson, Betsy Farber
Question Posted:
Students also viewed these Mathematics questions
-
Consider each situation described. Identify the population and the sample, explain what p and p represent, and tell whether the methods of this chapter can be used to create a confidence interval. a)...
-
A population of college students is taking an advanced math class. In the class are three juniors and two seniors. Using numbers 1, 2, and 3 to represent juniors and 4 and 5 to represent seniors,...
-
Drug use among college students in the United States was particularly heavy during the 1970s. Reporting on a study of drinking and drug use among college students in the United States in 1994, a...
-
In a recent study, Americans stated that they were willing to pay $70 billion to protect all endangered species and also stated that they were willing to pay $15 billion to protect a single species....
-
DS 16.3.2 contains the sample means i and the sample ranges ri of a variable measurement based upon samples of size n = 5, which are collected at k = 25 points in time. (a) Use this data set to...
-
Each team member is to become an expert on one depreciation method to facilitate teammates' understanding of that method. Follow these procedures: a. Each team member is to select an area of...
-
Information from Goddard Picture Frames cash account as well as the January bank statement is presented next. Requirements 1. Prepare the bank reconciliation on January 31. 2. Prepare all necessary...
-
The manufacturer in Problem 2-24 now has a standing order of 24 model A motors for each production period. Resolve Problem 2-24 to include this additional constraint. In problem 2-24 A small motor...
-
Identify the variables relevant to each segment. Please help me figure out how to determine or tell when a variable is relevant one or not in each segments. Which segmentation yields better results?...
-
Sparrow Corporation (a calendar year, accrual basis taxpayer) had the following transactions in 2018, its second year of operation. Taxable income...
-
A teaching conference has an attendance of 6855 people. Of these, 3120 are college professors and 3595 are male. Of the college professors, 1505 are male. Find the probability that a randomly...
-
Use the frequency distribution in Exercise 16 to construct an expanded frequency distribution, as shown in Example 2. Data from Exercise 16: Toledo, OH, Average Normal Temperatures (F) Class...
-
What is boiling point diagram? Discuss it for benzene-toluene system.
-
Consider a model with two periodsthe first time period is the four years after high school and the second time period is the next 40 years. A person without a college education receives \($120,000\)...
-
A research group claims that the median age of the users of a social networking website is less than 32 years old. In a random sample of 20 users, 5 are less than 32 years old, 13 are more than 32...
-
A financial services accountant claims that the median amount of financial debt for families holding such debts is less than \(\$ 60,000\). In a random sample of 70 families with financial debt, the...
-
In determining the primary responsibility of the external auditor for a company's financial statements, the auditor owes primary allegiance to: a. The management of the company being audited because...
-
During a weather report, a meteorologist claims that the median daily high temperature for the month of January in San Diego is \(66^{\circ}\) Fahrenheit. The high temperatures (in degrees...
-
Sally owns real property for which the annual property taxes are $9,000. She sells the property to Kate on March 9, 2017, for $550,000. Kate pays the real property taxes for the entire year on...
-
The rate at which the temperature of an object changes is proportional to the difference between its own temperature and the temperature of the surrounding medium. Express this rate as a function of...
-
In Exercises 35, (a) Construct a scatter plot of the data, (b) Identify any possible outliers, (c) Determine whether the point is influential. Explain your reasoning. r 56 9 10 14 17 19 44 y32 33 28...
-
In Exercises 36, (a) Construct a scatter plot of the data, (b) Identify any possible outliers, (c) Determine whether the point is influential. Explain your reasoning. x 1 3 6 8 12 14 4 7 10 9 15 3
-
Find the equation of the regression line for the data. Then construct a scatter plot of (x, y) and sketch the regression line with it. Use the data shown in the table given below, which shows the...
-
Jeff Getler sold (short) 30 ounces of gold at $1,500/oz and bought (long) 3,000 ounces of silver at $16/oz. The initial and maintenance margins for each position are, $4,500/$2,900 (gold) and...
-
Lauren Wang invented a simple stock index which has futures contracts traded on it. The index is composed of three stocks whose current values are $50, $120 and $80, respectively. The index is...
-
Using IBM balance sheet and income statement, create common-size, common base-year, and common-size, common base-year financial statements. Part IV: Financial Ratios Using IBM financial statements,...
Study smarter with the SolutionInn App