

Question: The table shows the sixth, seventh, and eighth grade student enrollment levels (in thousands) in Minnesota and Ohio schools in a recent year. A student
The table shows the sixth, seventh, and eighth grade student enrollment levels (in thousands) in Minnesota and Ohio schools in a recent year.
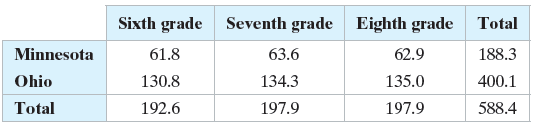
A student in one of the indicated grades and states is randomly selected. Find the probability of selecting a student who
(a) is in sixth grade
(b) is in sixth or seventh grade
(c) is in eighth grade, given that the student is enrolled in Minnesota
(d) is enrolled in Ohio, given that the student is in seventh grade
(e) is in seventh grade or is enrolled in Minnesota
(f) is in sixth grade and is enrolled in Ohio
Sixth grade Seventh grade Eighth grade Total 63.6 62.9 188.3 Minnesota 61.8 Ohio 130.8 134.3 400.1 135.0 Total 192.6 197.9 197.9 588.4
Step by Step Solution
3.43 Rating (159 Votes )
There are 3 Steps involved in it
a b c d ... View full answer

Get step-by-step solutions from verified subject matter experts