

Question: Use frequency distribution formulas to estimate the sample mean and the sample standard deviation of the data set in Exercise 2. Data from exercise 2:
Use frequency distribution formulas to estimate the sample mean and the sample standard deviation of the data set in Exercise 2.
Data from exercise 2:
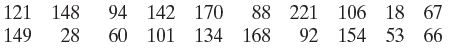
The data set represents the numbers of movies that a sample of 20 people watched in a year.
(a) Construct a frequency distribution for the data set using six classes.
Include class limits, midpoints, boundaries, frequencies, relative frequencies, and cumulative frequencies.
(b) Display the data using a frequency histogram and a frequency polygon on the same axes.
(c) Display the data using a relative frequency histogram.
(d) Describe the shape of the distribution as symmetric, uniform, skewed left, skewed right, or none of these.
(e) Display the data using an ogive.
121 88 221 106 18 67 92 154 53 66 148 94 142 170 28 60 101 149 134 168
Step by Step Solution
3.34 Rating (178 Votes )
There are 3 Steps involved in it
2254 20 Midpoint Frequency X f 345 685 1025 1365 1705 ... View full answer

Get step-by-step solutions from verified subject matter experts