

Question: Use the data set, which represents wait times (in minutes) for various services at a states Department of Motor Vehicles locations. Draw an ogive to
Use the data set, which represents wait times (in minutes) for various services at a state’s Department of Motor Vehicles locations.
Draw an ogive to show corresponding percentiles for the data.
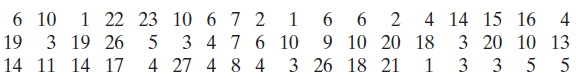
1 22 23 10 6 7 2 3 19 26 11 14 17 4 14 15 16 3 20 10 13 3 6 10 4 3 4 7 6 10 5 4 27 4 8 4 9 10 19 20 18 3 26 18 21 3 14 5 5
Step by Step Solution
★★★★★
3.44 Rating (157 Votes )
There are 3 Steps involved in it
1 Expert Approved Answer
Step: 1 Unlock

Percentile 100 90 80 70 ... View full answer
Question Has Been Solved by an Expert!
Get step-by-step solutions from verified subject matter experts
Step: 2 Unlock
Step: 3 Unlock