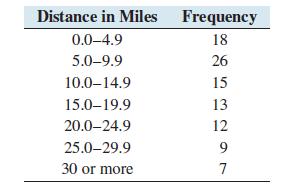
A company surveyed 100 employees to find out how far they travel in their commute to work.
Question:
A company surveyed 100 employees to find out how far they travel in their commute to work. The results are presented in the following frequency distribution.
Explain why it is not possible to construct a histogram for this data set.
Fantastic news! We've Found the answer you've been seeking!
Step by Step Answer:
Related Book For 

Question Posted:


