a. Using a computer or a random-numbers table, simulate the drawing of 100 samples, each of size
Question:
a. Using a computer or a random-numbers table, simulate the drawing of 100 samples, each of size 5, from the uniform probability distribution of single-digit integers, 0 to 9.
b. Find the mean for each sample.
c. Construct a histogram of the sample means.
(Use integer values as class midpoints.)
d. Describe the sampling distribution shown in the histogram in part c.
MINITAB (Release 14)
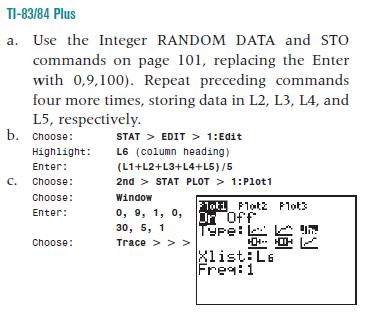
a. Use the Integer RANDOM DATA commands on page 101, replacing generate with 100, store in with C1–C5, minimum value with 0, and maximum value with 9.
b. Choose: Calc Row Statistics Select: Mean Enter: Input variables: C1–C5 Store result in: C6 OK
c. Use the HISTOGRAM commands on page 61 for the data in C6. To adjust the histogram, select Binning with midpoint and midpoint positions 0:9/1.
Excel
a. Input 0 through 9 into column A and corresponding 0.1’s into column B; then continue with:
Choose: Tools Data Analysis Random Number Generation
OK Enter: Number of Variables: 5 Number of Random Numbers: 100 Distribution: Discrete Value and Probability Input Range: (A1:B10 or select cells)
Select: Output Range:
Enter: (C1 or select cell) OK
b. Activate cell H1.
Choose: Insert function, fx Statistical AVERAGE
OK Enter: Number1: (C1:G1 or select cells)
Drag: Bottom right corner of average value box down to give other averages
c. Use the HISTOGRAM commands on pages 61–
62 with column H as the input range and column A as the bin range.

Step by Step Answer:

Just The Essentials Of Elementary Statistics
ISBN: 9780495314875
10th Edition
Authors: Robert Johnson, Patricia Kuby


