

Construct a histogram for the data in Exercise 22. Explain how the histogram shows whether it is
Question:
Construct a histogram for the data in Exercise 22.
Explain how the histogram shows whether it is appropriate to treat this sample as coming from an approximately normal population.
Exercise 22
A manufacturer of aluminum cans measured the level of impurities in 24 cans. The amounts of impurities, in percent, were as follows.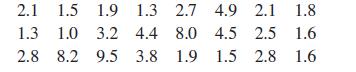
Construct a boxplot for this sample. Is it reasonable to treat the sample as coming from an approximately normal population?
Explain.
Fantastic news! We've Found the answer you've been seeking!
Step by Step Answer:

Answered By
Nazrin Ziad
I am a post graduate in Zoology with specialization in Entomology.I also have a Bachelor degree in Education.I posess more than 10 years of teaching as well as tutoring experience.I have done a project on histopathological analysis on alcohol treated liver of Albino Mice.
I can deal with every field under Biology from basic to advanced level.I can also guide you for your project works related to biological subjects other than tutoring.You can also seek my help for cracking competitive exams with biology as one of the subjects.
2+ Reviews
10+ Question Solved
Related Book For 

Question Posted:
