

Construct and interpret an interaction plot for the data in Exercise 15. Exercise 15 An education professor
Question:
Construct and interpret an interaction plot for the data in Exercise 15.
Exercise 15
An education professor wants to find out which subject students find most difficult. She obtains final exam scores for three randomly selected freshmen and three randomly selected sophomores from three subjects, statistics, psychology, and history. The results are as follows.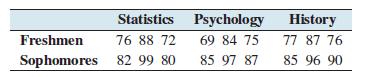
Step by Step Answer:

This question has not been answered yet.
You can Ask your question!
Related Book For 

Question Posted:
