

Identifying Total Variation What percentage of the total variation in height can be explained by the linear
Question:
Identifying Total Variation What percentage of the total variation in height can be explained by the linear correlation between foot length and height?
Interpreting a Computer Display. In Exercises 9–12, refer to the display obtained by using the paired data consisting of foot lengths (cm) and heights (cm) of 40 people .
(Unlike the examples in this section, these exercises use foot lengths instead of shoe print lengths.) Along with the paired sample data, a foot length of 29.0 cm is used for predicting height.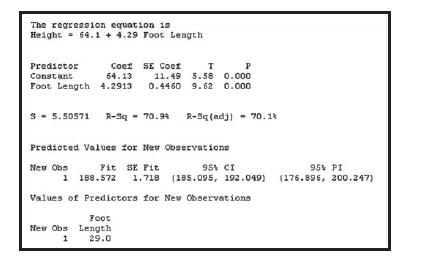
Fantastic news! We've Found the answer you've been seeking!
Step by Step Answer:

Answered By
Diksha Bhasin
I have been taking online teaching classes from past 5 years, i.e.2013-2019 for students from classes 1st-10th. I also take online and home tuitions for classes 11th and 12th for subjects – Business Studies and Economics from past 3 years, i.e. from 2016-2019. I am eligible for tutoring Commerce graduates and post graduates. I am a responsible for staying in contact with my students and maintaining a high passing rate.
1+ Reviews
10+ Question Solved
Related Book For 

Elementary Statistics Using Excel Pearson New
ISBN: 978-1292041766
5th Edition
Authors: Mario F Triola
Question Posted:
