

Mr. B, store manager in Exercise 13.69 (and Exercises 12.3612.38), found the data from the months of
Question:
Mr. B, store manager in Exercise 13.69 (and Exercises 12.36–12.38), found the data from the months of November and December to be different from the data for the other months. Since the data that is separate from the rest in the scatter diagram in Exercise 13.69 is from November and December, let’s remove the November and December values and investigate the relationship between the number of customers per day and the number of items purchased per day for the first 10 months of the year.
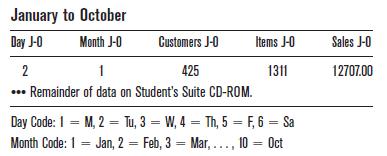
a. Use your calculator or computer to construct the scatter diagram for the data for January to October.
b. Describe the graphical evidence found and discuss the linearity. Are there any ordered pairs that appear to be different from the others?
c. What is the relationship between the number of customers per day and the number of items purchased per day for the first 10 months of the year?
d. Is the slope of the regression line significant at 0.05?
e. Give the 95% prediction interval for the number of items that one would expect to be purchased if the number of customers were 600.
Step by Step Answer:


Just The Essentials Of Elementary Statistics
ISBN: 9780495314875
10th Edition
Authors: Robert Johnson, Patricia Kuby
