

Mr. B, the manager at a large retail store, is investigating several variables while measuring the level
Question:
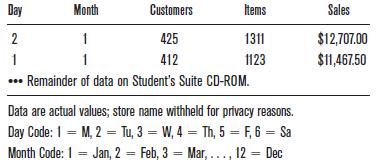
Mr. B, the manager at a large retail store, is investigating several variables while measuring the level of his business. His store is open every day during the year except for New Year’s Day, Christmas, and all Sundays. From his records, which cover several years prior, Mr. B has randomly identified 62 days and collected data for the daily total for three variables: number of paying customers, number of items purchased, and total cost of items purchased.
Is there evidence to claim a linear relationship between the two variables number of customers and number of items purchased?
The computer output that follows resulted from analysis of the data.
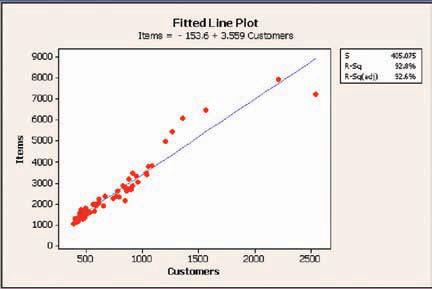
Regression Analysis: Items versus Customers The regression equation is Items 154 3.56 Customers Predictor Coef SE Coef T P Constant 153.6 108.2 1.42 0.161 Customers 3.5591 0.1284 27.71 0.000 S 405.075 R-Sq 92.8% R-Sq(adj) 92.6%
Inspect the preceding scatter diagram and the regression analysis output for number of customers versus number of items purchased. Look for evidence that either supports or contradicts the claim, “There is a linear relationship between the two variables.”
a. Describe the graphical evidence found and discuss how it shows lack of linearity for the entire range of values. Which ordered pairs appear to be different from the others?
b. Describe how the numerical evidence shown indicates the linear model does fit this data.
Explain.
c. Some of the evidence seems to indicate the linear model is the correct model, and some evidence indicates the opposite. What months provided the points that are separate from the rest of the pattern? What is going on in those months that might cause this?
Step by Step Answer:


Just The Essentials Of Elementary Statistics
ISBN: 9780495314875
10th Edition
Authors: Robert Johnson, Patricia Kuby
