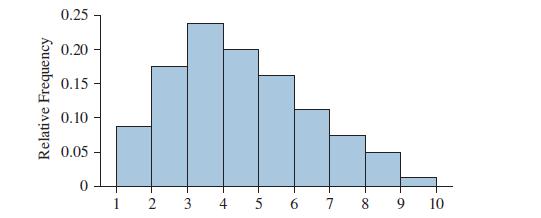
The following histogram presents a data set with a mean of 4.5 and a standard deviation of
Question:
The following histogram presents a data set with a mean of 4.5 and a standard deviation of 2.
Is it appropriate to use the Empirical Rule to approximate the proportion of the data between 0.5 and 8.5? If so, find the approximation. If not, explain why not.
Fantastic news! We've Found the answer you've been seeking!
Step by Step Answer:
Related Book For 

Question Posted:


