

The following pie chart presents the percentages of the U.S. federal budget spent in various categories during
Question:
The following pie chart presents the percentages of the U.S. federal budget spent in various categories during a recent year.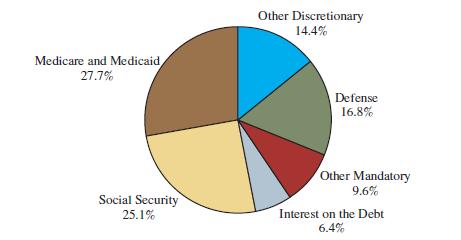
a. Construct a relative frequency bar graph for these data.
b. Construct a relative frequency Pareto chart for these data.
c. In which category was the largest amount spent?
d. Social Security, Medicare and Medicaid, and interest on the debt are considered to be mandatory spending because they fulfill promises made by the government ahead of time.
Including other mandatory spending with these categories, what percentage of the spending was mandatory?
Step by Step Answer:

This question has not been answered yet.
You can Ask your question!
Related Book For 

Question Posted:
