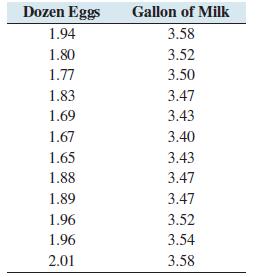
The following table presents the average price in dollars for a dozen eggs and a gallon of
Question:
The following table presents the average price in dollars for a dozen eggs and a gallon of milk for each month in a recent year.
a. Construct a scatterplot of the price of milk (y) versus the price of eggs (x).
b. Compute the correlation coefficient between the price of eggs and the price of milk.
c. In a month where the price of eggs is above average, would you expect the price of milk to be above average or below average? Explain.
d. Which of the following is the best interpretation of the correlation coefficient?
i. When the price of eggs rises, it causes the price of milk to rise.
ii. When the price of milk rises, it causes the price of eggs to rise.
iii. Changes in the price of eggs or milk do not cause changes in the price of the other; the correlation indicates that the prices of milk and eggs tend to go up and down together.
Step by Step Answer:


