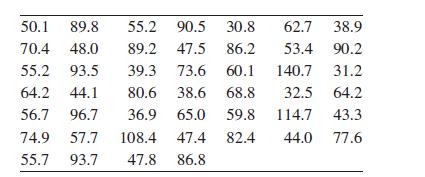
The following table presents the manufacturers suggested retail price (in $1000s) for 2003 base models and styles
Question:
The following table presents the manufacturer’s suggested retail price (in $1000s) for 2003 base models and styles of BMW automobiles.

a. Round the data to the nearest whole number (round .5 up)
and construct a stem-and-leaf plot, using the numbers 3 through 14 as the stems.
b. Repeat part (a), but split the stems, using two lines for each stem.
c. Which stem-and-leaf plot do you think is more appropriate for these data, the one in part
(a) or the one in part (b)? Why?
Step by Step Answer:
Related Book For 

Question Posted:


