

The Nielsen Company estimated the numbers of people in various gender and age categories who used a
Question:
The Nielsen Company estimated the numbers of people in various gender and age categories who used a video game console. The results are presented in the following frequency distribution.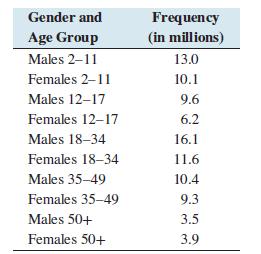
a. Construct a frequency bar graph.
b. Construct a relative frequency distribution.
c. Construct a relative frequency bar graph.
d. Construct a pie chart.
e. True or false: More than half of video gamers are male.
f. True or false: More than 40% of video gamers are female.
g. What proportion of video gamers are 35 or over?
Step by Step Answer:

This question has not been answered yet.
You can Ask your question!
Related Book For 

Question Posted:
