All Matches
Solution Library
Expert Answer
Textbooks
Search Textbook questions, tutors and Books
Oops, something went wrong!
Change your search query and then try again
Toggle navigation
FREE Trial
S
Books
FREE
Tutors
Study Help
Expert Questions
Accounting
General Management
Mathematics
Finance
Organizational Behaviour
Law
Physics
Operating System
Management Leadership
Sociology
Programming
Marketing
Database
Computer Network
Economics
Textbooks Solutions
Accounting
Managerial Accounting
Management Leadership
Cost Accounting
Statistics
Business Law
Corporate Finance
Finance
Economics
Auditing
Hire a Tutor
AI Study Help
New
Search
Search
Sign In
Register
study help
engineering
design and analysis of experiments
Questions and Answers of
Design And Analysis Of Experiments
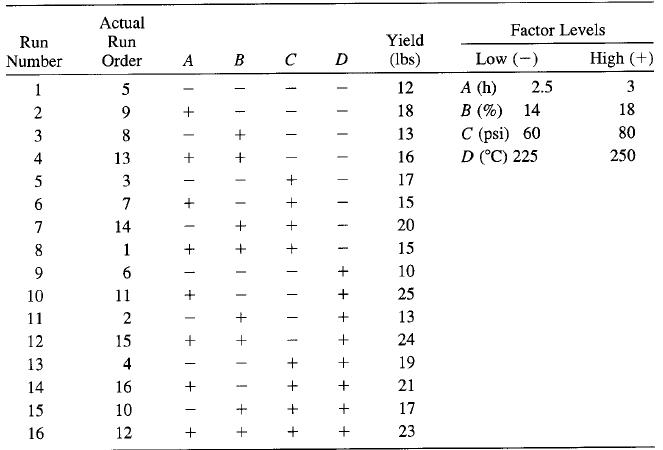
Consider the single replicate of the 24 design in Example 6-2. Suppose that we ran five points at the center (0, 0, 0, 0) and observed the following responses: 73, 75, 71, 69, and 76. Test for
Compute the I and J components of the two-factor interactions for Example 10-1.
Consider the 24 factorial experiment in Example 6-2. Suppose that the last observation is missing. Reanalyze the data and draw conclusions. How do these conclusions compare with those from the
Consider the 24 factorial experiment in Example 6-2. Suppose that the last two observations are missing. Reanalyze the data and draw conclusions. How do these conclusions compare with those from the
Consider the three-factor factorial design in Example 12-6. Propose appropriate test statistics for all main effects and interactions. Repeat for the case where A and B are fixed and C is random.
Consider the experiment in Example 12-7. Analyze the data for the case where A, B, and C are random.
Apply the general regression significance test to the experiment in Example 3-1. Show that the procedure yields the same results as the usual analysis of variance.
Use the regression model in part (c) of Problem 6-23 to generate a response surface contour plot of yield. Discuss the practical value of this response surface plot.Problem 6-23In a process
A missing value in a 24 factorial. It is not unusual to find that one of the observations in a 2k design is missing due to faulty measuring equipment, a spoiled test, or some other reason. If the
Several times we have used the hierarchy principle in selecting a model; that is, we have included nonsignificant lower-order terms in a model because they were factors involved in significant
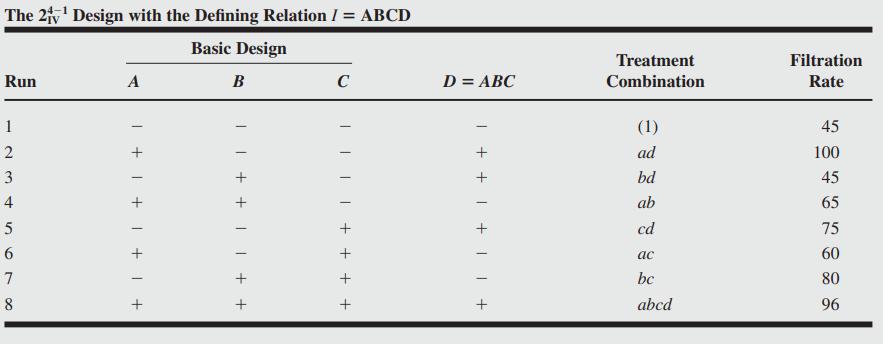
Project the 24-1IV design in Example 8-1 into two replicates of a 22 design in the factors A and B. Analyze the data and thaw conclusions.Example 8-1:Consider the filtration rate experiment in
Consider the 26-3III design in Problem 8-15. Determine the effects that may be estimated if a second fraction of this design is run with the signs for factor A reversed.
Fold over the 27-4III design in Table 8-19 to produce an eight-factor design. Verify that the resulting design is a 28-4IV design. Is this a minimal design?
Suppose that in Problem 13-22 four technicians had been used. Assuming that all the factors are fixed, how many blocks should be run to obtain an adequate number of degrees of freedom on the test for
Consider the experiment described in Example 13-3. Demonstrate how the order in which the treatment combinations are run would be determined if this experiment were run as(a) A split-split-plot,(b) A
In Example 6-3 we selected a log transformation for the drill advance rate response. Use the Box-Cox procedure to demonstrate that this is an appropriate data transformation.
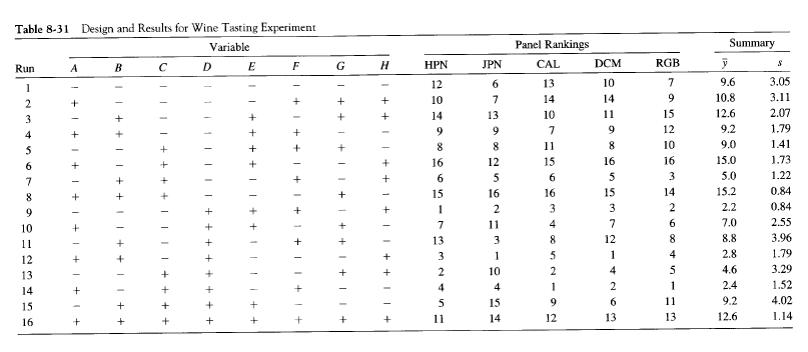
Reconsider the smelting process experiment in Problem 8-23, where a 26-3 fractional factorial design was used to study the weight of packing material that is stuck to carbon anodes after baking. Each
Discuss how the operating characteristic curves for the analysis of variance can be used in the analysis of covariance.
Show that in a single-factor analysis of covariance with a single covariate, the standard error of the difference between any two adjusted treatment means is 1/2 2, MSE (X - X) SAdjy.- Adjyj.
Show that in a single-factor analysis of covariance with a single covariate a 100(1 – α) percent confidence interval on the ith adjusted treatment mean is Using this formula, calculate a 95
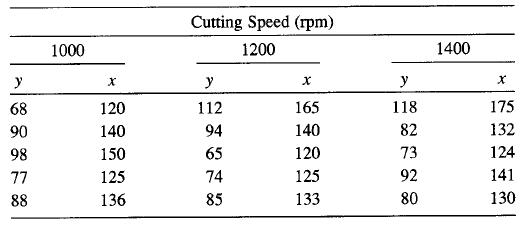
An engineer is studying the effect of cutting speed on the rate of metal removal in a machining operation. However, the rate of metal removal is also related to the hardness of the test specimen.
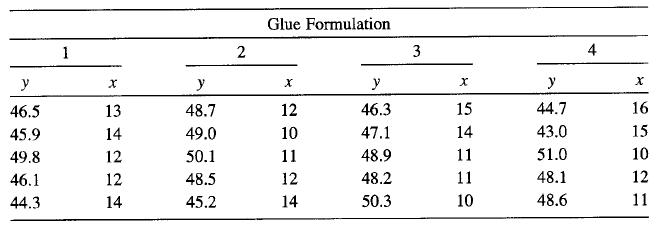
Compute the adjusted treatment means and their standard errors using the data in Problem 14-14. Problem 14-14. Four different formulations of an industrial glue are being tested. The
Four different formulations of an industrial glue are being tested. The tensile strength of the glue when it is applied to join parts is also related to the application thickness. Five observations
The sums of squares and products for a single-factor analysis of covariance follow. Complete the analysis and draw appropriate conclusions. Use α = 0.05. Sums of Squares and Products Degrees of
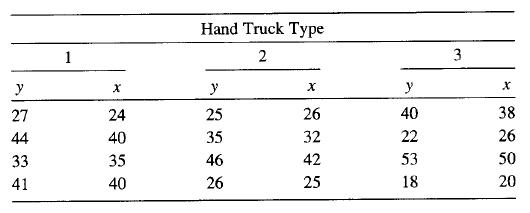
Compute the adjusted treatment means and the standard errors of the adjusted treatment means for the data in Problem 14-10.Problem 14-10.A soft drink distributor is studying the effectiveness of
A soft drink distributor is studying the effectiveness of delivery methods. Three different types of hand trucks have been developed, and an experiment is performed in the company's methods
Problem 11-34 suggests using In (s2) as the response [refer to part (b)]. Does the Box-Cox method indicate that a transformation is appropriate?Problem 11-34In Example 6-2 we found that one of the
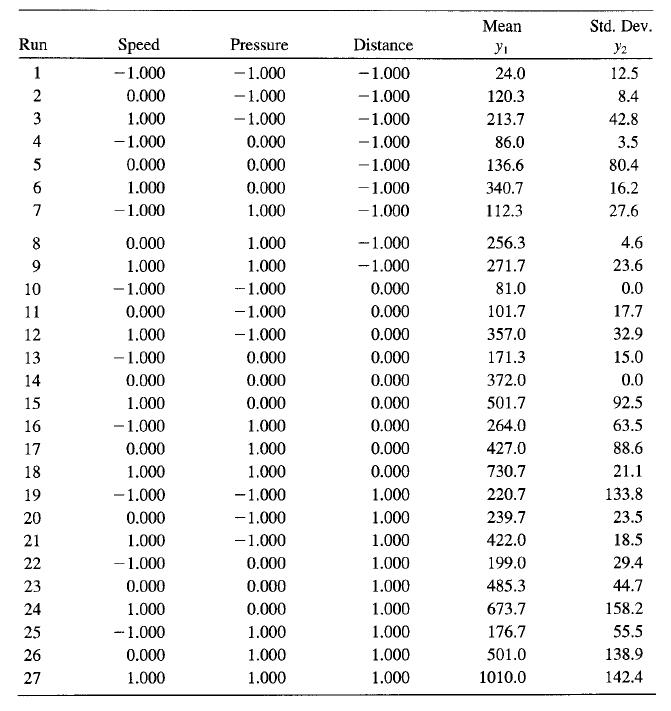
In the 33 factorial design of Problem 11-33 one of the responses is a standard deviation. Use the Box-Cox method to investigate the usefulness of transformations for this response. Would your answer
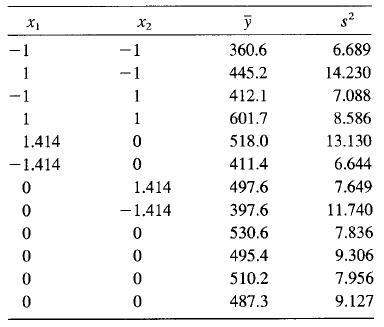
In the central composite design of Problem 11-14, two responses were obtained, the mean and variance of an oxide thickness. Use the Box-Cox method to investigate the potential usefulness of
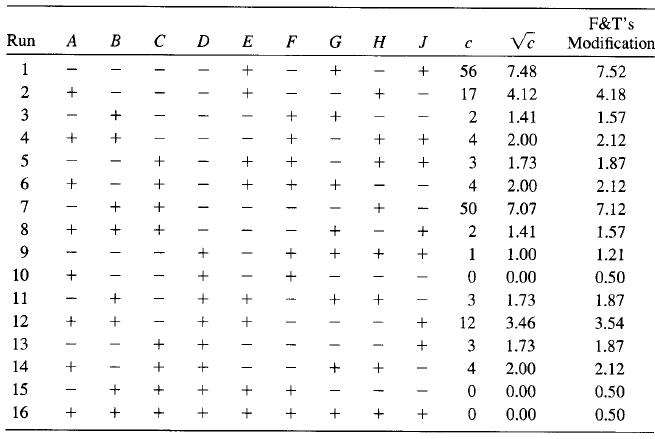
In the grill defects experiment described in Problem 8-29, a variation of the square root transformation was employed in the analysis of the data. Use the Box-Cox method to determine if this is
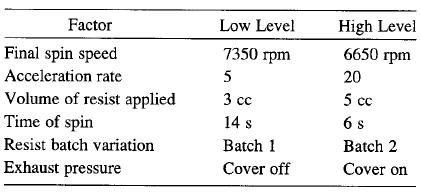
Reconsider the photoresist experiment in Problem 8-25. Use the variance of the resist thickness at each test combination as the response variable. Is there any indication that a transformation is
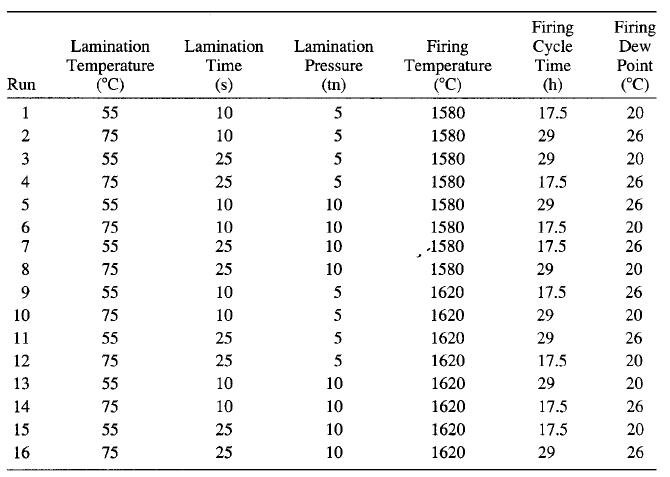
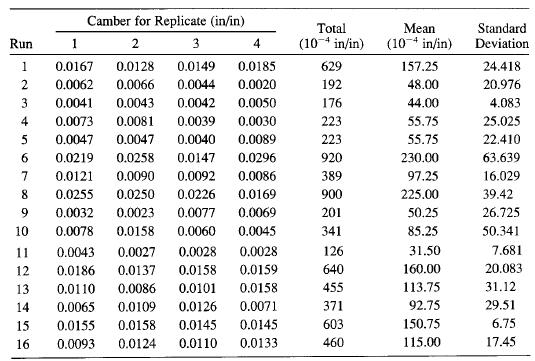
In Problem 8-24 a replicated fractional factorial design was used to study substrate camber in semiconductor manufacturing. Both the mean and standard deviation of the camber measurements were used
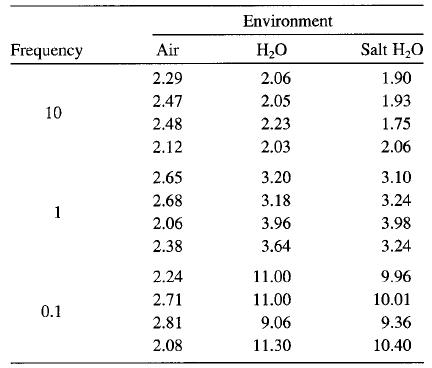
Reconsider the experiment in Problem 5-22. Use the Box-Cox procedure to determine if a transformation on the response is appropriate (or useful) in the analysis of the data from this
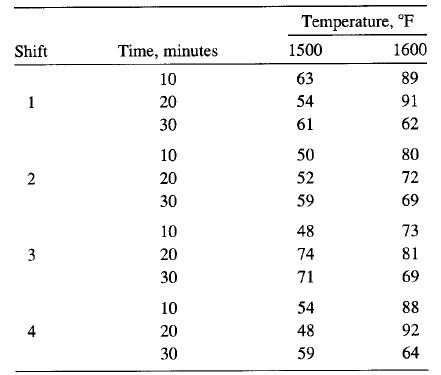
Rework Problem 13-22, assuming that the technicians are chosen at random. Use the restricted form of the mixed model.Problem 13-22Consider the split-split-plot design described in Example 13-3.
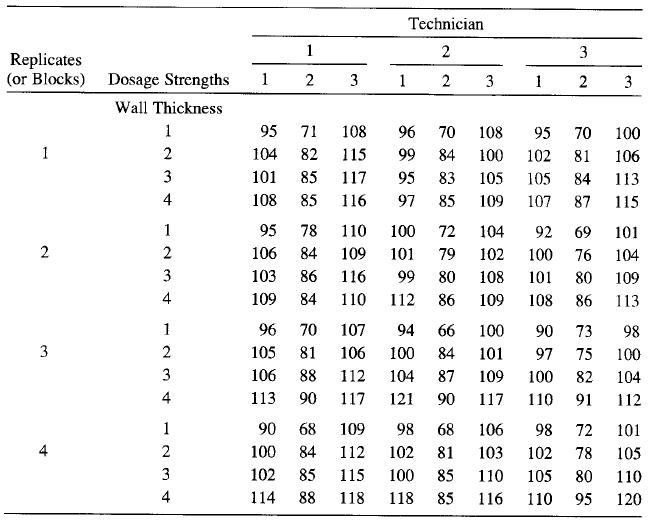
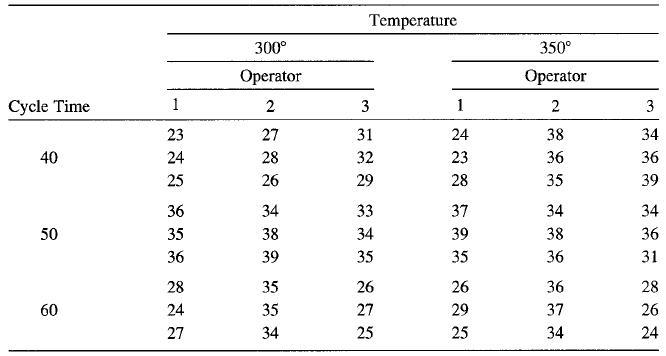
Consider the split-split-plot design described in Example 13-3. Suppose that this experiment is conducted as described and that the data shown in the following table are obtained. Analyze the data
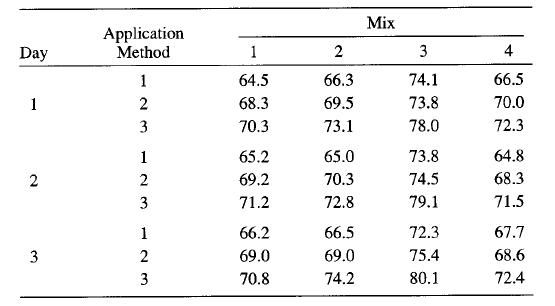
Repeat Problem 13-20, assuming that the mixes are random and the application methods are fixed.Problem 13-20An experiment is designed to study pigment dispersion in paint. Four different mixes of a
An experiment is designed to study pigment dispersion in paint. Four different mixes of a particular pigment are studied. The procedure consists of preparing a particular mix and then applying that
Steel is normalized by heating above the critical temperature, soaking, and then air cooling. This process increases the strength of the steel, refines the grain, and homogenizes the structure. An
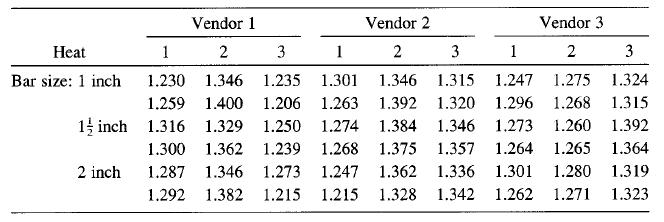
Suppose that in Problem 13-16 the bar stock may be purchased in many sizes and that the three sizes actually used in the experiment were selected randomly. Obtain the expected mean squares for this
Rework Problem 13-16 using the unrestricted form of the mixed model. You may use a computer software package to do this. Comment on any differences between the restricted and unrestricted model
A structural engineer is studying the strength of aluminum alloy purchased from three vendors. Each vendor submits the alloy in standard-sized bars of 1.0, 1.5, or 2.0 inches. The processing of
Reanalyze the experiment in Problem 13-14 assuming the unrestricted form of the mixed model. You may use a computer software package to do this. Comment on any differences between the restricted and
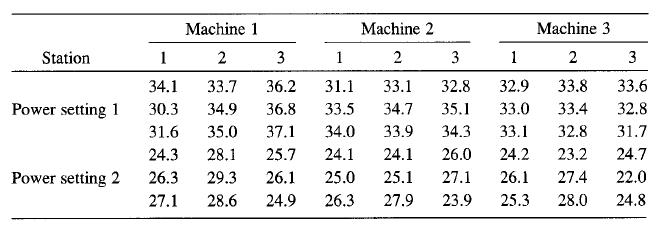
Suppose that in Problem 13-13 a large number of power settings could have been used and that the two selected for the experiment were chosen randomly. Obtain the expected mean squares for this
A process engineer is testing the yield of a product manufactured on three machines. Each machine can be operated at two power settings. Furthermore, a machine has three stations on which the product
Consider the model Where A and B are random factors. Show thatAnd i = 1, 2, ..., a j = 1, 2,..., b, k = 1, 2, ..., nij Yijk = u + T; + Bi) + EKi) %3D
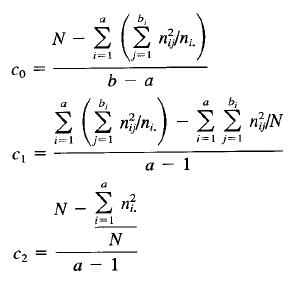
Unbalanced nested designs. Consider an unbalanced two-stage nested design with bj levels of B under the ith level of A and nij replicates in the ijth cell.(a) Write down the least squares normal
Verify the expected mean squares given in Table 13-1.Table 13-1. A Fixed B Fixed A Fixed B Random A Random E(MS) B Random bn 2 T o + bn Σή o? + nơ + bno; E(MSA) o? + nơ + a - 1 a 1 E(MS B(A) o? +
Derive the expected mean squares for a balanced three-stage nested design if all three factors are random. Obtain formulas for estimating the variance components.
Repeat Problem 13-7 assuming the unrestricted form of the mixed model. You may use a computer software package to do this. Comment on any differences between the restricted and unrestricted model
Derive the expected mean squares for a balanced three-stage nested design, assuming that A is fixed and that B and C are random. Obtain formulas for estimating the variance components. Assume the
Reanalyze the experiment in Problem 13-5 using the unrestricted form of the mixed model. Comment on any differences you observe between the restricted and the unrestricted model results. You may use
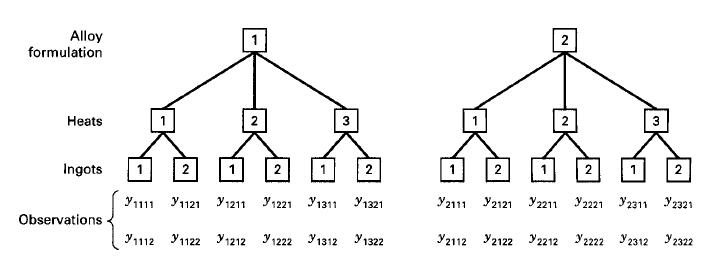
Consider the three-stage nested design shown in Figure 13-5 to investigate alloy hardness. Using the data that follow, analyze the design, assuming that alloy chemistry and heats are fixed factors
To simplify production scheduling, an industrial engineer is studying the possibility of assigning one time standard to a particular class of jobs, believing that differences between jobs are
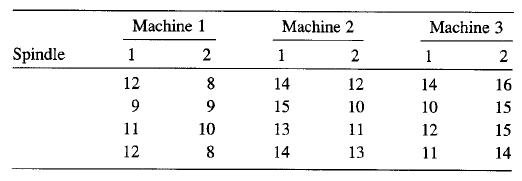
A manufacturing engineer is studying the dimensional variability of a particular component that is produced on three machines. Each machine has two spindles, and four components are randomly selected
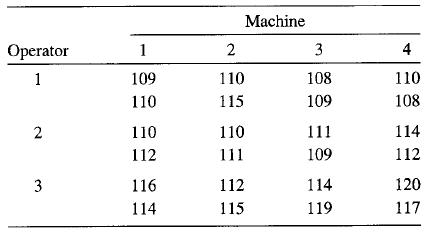
The surface finish of metal parts made on four machines is being studied. An experiment is conducted in which each machine is run by three different operators and two specimens from each operator are
A rocket propellant manufacturer is studying the burning rate of propellant from three production processes. Four batches of propellant are randomly selected from the output of each process and three
Rework Problem 12-32 using the modified large-sample method described in Section 12-7.2. Compare this confidence interval with the one obtained previously and discuss.Problem 12-32Consider the
Consider the variance components in the random model from Problem 12-9.(a) Find an exact 95 percent confidence interval on σ2.(b) Find approximate 95 percent confidence intervals on the other
Rework Problem 12-30 using the modified large-sample approach described in Section 12-7.2. Compare the two sets of confidence intervals obtained and discuss.Problem 12-30Consider the variance
Consider the three-factor experiment in Problem 5-17 and assume that operators were selected at random. Find an approximate 95 percent confidence interval on the operator variance component.Problem
Use the experiment described in Problem 5-6 and assume that both factors are random. Find an exact 95 percent confidence interval on as. Construct approximate 95 percent confidence intervals on the
Consider the variance components in the random model from Problem 12-9.(a) Find an exact 95 percent confidence interval on σ2.(b) Find approximate 95 percent confidence intervals on the other
Analyze the data in Problem 12-9, assuming that operators are fixed, using both the unrestricted and the restricted form of the mixed models. Compare the results obtained from the two models.Problem
Invoking the usual normality assumptions, find an expression for the probability that a negative estimate of a variance component will be obtained by the analysis of variance method. Using this
Show that the method of analysis of variance always produces unbiased point estimates of the variance components in any random or mixed model.
In the two-factor mixed model analysis of variance, show that Cov[(TB)y. (TB)r,] = -(1/a)og for i + i'. %3D
In Problem 5-6, assume that both machines and operators were chosen randomly. Determine the power of the test for detecting a machine effect such that σ2β = σ2, where σ2β is the variance
The three-factor factorial model for a single replicate is If all the factors are random, can any effects be tested? If the three-factor and (τβ)ij interactions do not exist, can all the
Consider the three-factor factorial modelAssuming that all the factors are random, develop the analysis of variance table, including the expected mean squares. Propose appropriate test statistics for
In Problem 5-17, assume that the three operators were selected at random. Analyze the data under these conditions and draw conclusions. Estimate the variance components.Problem 5-17The quality
Reconsider the wave soldering experiment in Problem 12.16. Suppose that it was necessary to fit a complete quadratic model in the controllable variables, all main effects of the noise variables, and
Consider a four-factor factorial experiment where factor A is at a levels, factor B is at b levels, factor C is at c levels, factor D is at d levels, and there are n replicates. Write down the sums
Derive the expected mean squares shown in Table 12-14.Table 12-14 Table 12-14 Analysis of Variance for the Pressure Drop Data Source of Variation Sum of Degrees of Freedom Mean Squares Expected Mean
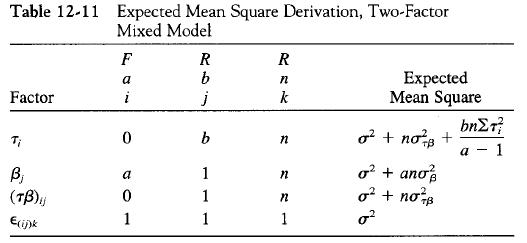
By application of the expectation operator, develop the expected mean squares for the two-factor factorial, mixed model. Use the restricted model assumptions. Check your results with the expected
In Problem 5-6, suppose that there are only four machines of interest, but the operators were selected at random.(a) What type of model is appropriate?(b) Perform the analysis and estimate the model
Reanalyze the measurement systems experiment in Problem 12-9, assuming that opera-tors are a fixed factor. Estimate the appropriate model components.Problem 12-9An experiment was performed to
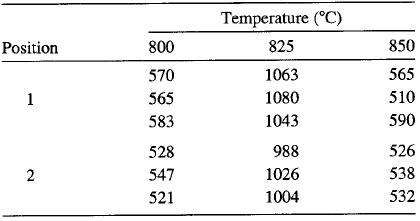
Suppose that in Problem 5-11 the furnace positions were randomly selected, resulting in a mixed model experiment. Reanalyze the data from this experiment under this new assumption. Estimate the
Reconsider the data in Problem 5-13. Suppose that both factors are random.(a) Analyze the data from this experiment.(b) Estimate the variance components.Problem 5-13.Consider the following data from
Reconsider the data in Problem 5-6. Suppose that both factors, machines and operators. are chosen at random.(a) Analyze the data from this experiment.(b) Find point estimates of the variance
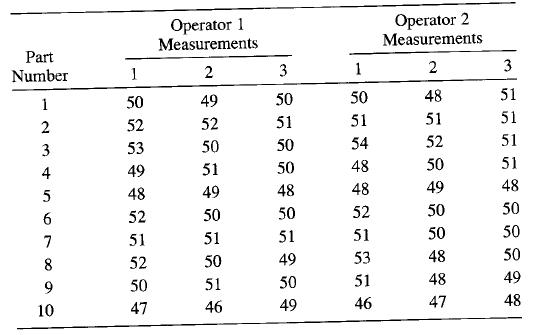
An experiment was performed to investigate the capability of a measurement system. Ten parts were randomly selected, and two randomly selected operators measured each part three times. The tests were
Refer to Problem 12-1.(a) What is the probability of accepting H0 if σ2τ is 4 times the error variance σ2?(b) If the difference between looms is large enough to increase the standard deviation of
Consider the one-way, balanced, random effects method. Develop a procedure for finding a 100(1 - a) percent confidence interval for σ2/(σ2τ + σ2).
Several ovens in a metal working shop are used to heat metal specimens. All the ovens are supposed to operate at the same temperature, although it is suspected that this may not be true. Three ovens
A manufacturer suspects that the batches of raw material furnished by his supplier differ significantly in calcium content. There are a large number of batches currently in the warehouse. Five of
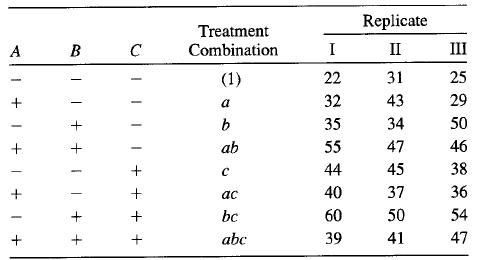
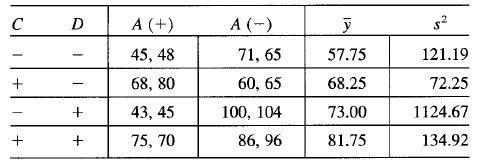
In Example 6-2 we found that one of the process variables (B = pressure) was not important. Dropping this variable produces two replicates of a 23 design. The data are shown below:Assume that C and D
An experiment has been run in a process that applies a coating material to a wafer. Each run in the experiment produced a wafer, and the coating thickness was measured several times at different
Consider the experiment in Problem 11-12. Suppose that temperature is a noise variable (σ2z = 1 in coded units). Fit response models for both responses. Is there a robust design problem with respect
Consider the bottle-filling experiment in Example 6-1. Suppose that the percentage of carbonation (A) is a noise variable (in coded units σ2z = 1).(a) Fit the response model to these data. Is there
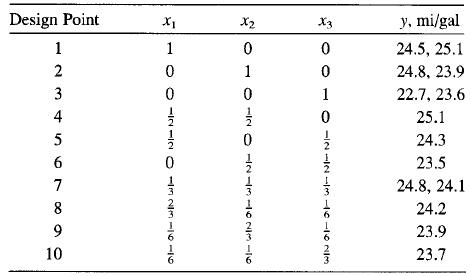
Myers and Montgomery (1995) describe a gasoline blending experiment involving three mixture components. There are no constraints on the mixture proportions, and the following 10-run design is
An experimenter wishes to run a three-component mixture experiment. The constraints in the component proportions are as follows:An experimenter wishes to run a three-component mixture experiment. The
Rework problem 11-27 assuming that the model the engineer wishes to fit is a quadratic. Obviously, only designs 2, 3, and 4 can now be considered.Problem 11-27A chemical engineer wishes to fit a
A chemical engineer wishes to fit a calibration curve for a new procedure used to measure the concentration of a particular ingredient in a product manufactured in his facility. Twelve samples can be
Repeat Problem 11-25 using a first-order model with the two-factor interactions.Problem 11-25Consider a 23 design for fitting a first-order model.(a) Evaluate the D-criterion |(X'X)-1| for this
Consider a 23 design for fitting a first-order model.(a) Evaluate the D-criterion |(X'X)-1| for this design.(b) Evaluate the A-criterion tr(X'X)-1 for this design.(c) Find the maximum scaled
Suppose that you need to design an experiment to fit a quadratic model over the region -1 ≤ xi ≤ +1, i = 1, 2 subject to the constraint x1 + x2 ≤ 1. If the constraint is violated, the
In an article ("Let's All Beware the Latin Square," Quality Engineering, Vol. 1, 1989, pp. 453-465), J. S. Hunter illustrates some of the problems associated with 3k-pfractional factorial designs.
Suppose that we approximate a response surface with a model of order d1, such as y = x1β1 + ∈, when the true surface is described by a model of order d2 > d1; that is, E(y) = X1β1 + X1β2.(a)
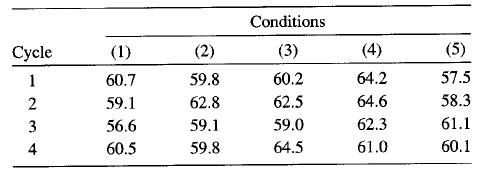
Yield during the first four cycles of a chemical process is shown in the following table. The variables are percentage of concentration (x1) at levels 30, 31, and 32 and temperature (x2) at 140, 142,
How could a hexagon design be run in two orthogonal blocks?
Consider a central composite design for k = 4 variables in two blocks. Can a rotatable design always be found that blocks orthogonally?
Showing 1 - 100
of 340
1
2
3
4