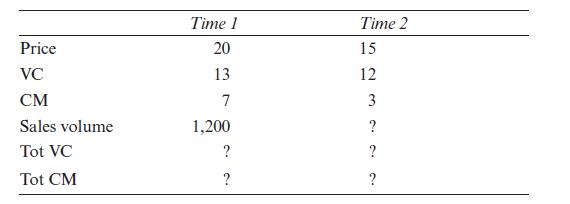
Provide a graphical illustration of (1) contribution lost due to price, (2) contribution gained due to volume,
Question:
Provide a graphical illustration of (1) contribution lost due to price, (2) contribution gained due to volume, and (3) total contribution and total variable costs for the new break- even sales volume, given the numbers presented below. The illustration should be similar to that presented in Figure 4.4, but also include the actual amounts of (1), (2), and (3).
Fantastic news! We've Found the answer you've been seeking!
Step by Step Answer:
Related Book For 

Question Posted:


