

Question: The execution times for three systems running five benchmarks are shown in the following table. Compare the relative performance of each of these systems (i.e.,
The execution times for three systems running five benchmarks are shown in the following table. Compare the relative performance of each of these systems (i.e., A to B, B to C, and A to C) using the arithmetic and geometric means. Are there any surprises? Explain.
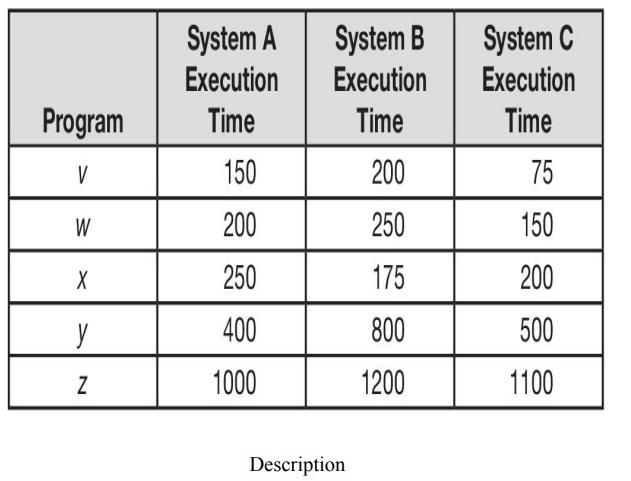
Program V W X y N System A Execution Time 150 200 250 400 1000 System B Execution Time 200 250 175 800 1200 Description System C Execution Time 75 150 200 500 1100
Step by Step Solution
3.40 Rating (144 Votes )
There are 3 Steps involved in it
Comparing the Relative Performance of Systems A B and C Using the arithmetic mean AM AM x1 x2 xnn Wh... View full answer

Get step-by-step solutions from verified subject matter experts