INTRODUCTION Video streaming services are a major entertainment delivery platform. Across the world, the rise in streaming
Question:
INTRODUCTION
Video streaming services are a major entertainment delivery platform. Across the world, the rise in streaming services often came at the expense of traditional cable and broadcast delivery platforms. As a result, traditional video content providers had to adapt to the streaming environment or risk becoming obsolete.
The subscription streaming video market was dominated by only a few major players. Netflix and Amazon Prime had been the acknowledged leaders in the vertical, with media giant Disney competing on a robust but more fragmented basis through its family of subsidiary content offerings (Disney+ and Hulu as well as the sports specialty service, ESPN+). In May 2020, AT&T’s WarnerMedia introduced its HBO Max streaming service as another alternative, replacing or enhancing previous incarnations (e.g., HBO Go, HBO Now) of their streaming platform. This case examines the launch of HBO Max.
At the time of the HBO Max launch, the legacy HBO streaming services (HBO Go, HBO Now) claimed only about 8 million subscribers. However, when including all traditional HBO cable/satellite subscribers, the combined number reached 35 million. By comparison, Netflix boasted 183 million subscribers;
Amazon Prime, 150 million; Disney+, 50 million;
Apple TV+, 33 million; and Hulu 30, million.1 YouTube, a more general, non-subscription-based streaming video platform, claimed well over 1.6 billion users globally.2 YouTube’s premium subscription service, YouTube Premium (formerly YouTube Red), however, claimed only about 20 million subscribers.3 Sling TV (a subsidiary of Dish Network) was a minor player, with fewer than 2.5 million subscribers in May 2020.
The launch of HBO Max was expected to bring the HBO streaming active user numbers more in line with leading competitors. According to AT&T’s WarnerMedia third quarter earnings report, the number of HBO and HBO Max U.S. subscribers exceeded company targets (38 million vs a 37 million target by the end of 2020) and reached 57 million globally.5 However, fewer than half of eligible subscribers had actually activated the service.6 The low activation rate was credited in large part to technical issues, as the HBO Max app was not readily available on major platforms like Roku and Amazon Fire TV.7 By October 2020, the general consensus about the HBO Max launch was “underwhelming,”8 despite a strong content library and increased overall viewership of streaming video due to the COVID-19 global pandemic.
UNDERSTANDING CUSTOMER PERCEPTIONS
To understand how customers felt about HBO Max postlaunch, a survey was sent to streaming customers to gauge their perceptions of the brand and its competitors. Various measures often associated with market success were collected in the survey. Customers were asked their likelihood to recommend the streaming service. This likelihood-to-recommend metric was then converted into the net promoter score (NPS) as a measure of how well the service was satisfying its customers.
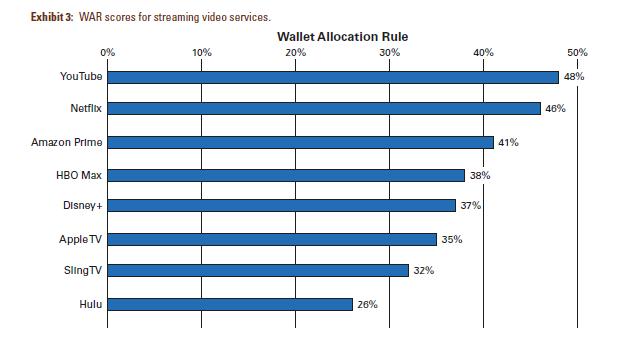
In addition to NPS, the likelihood-to-recommend question was used to estimate the share of streaming customers allocated to various services using the wallet allocation rule.
Market success was assessed by gauging the 1) penetration rate of various streaming services, 2) share of streaming services used (as a percentage of total viewing minutes), 3)
the average number of streaming services used, and 4) the total time customers spent using streaming services.
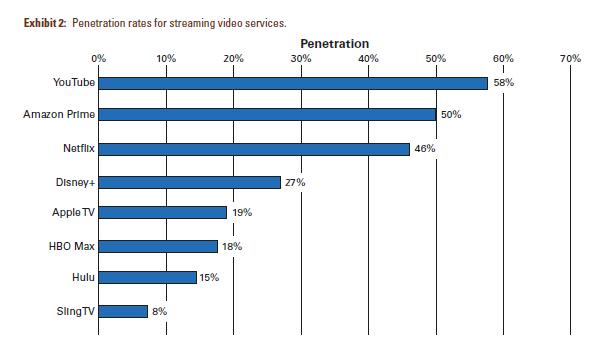
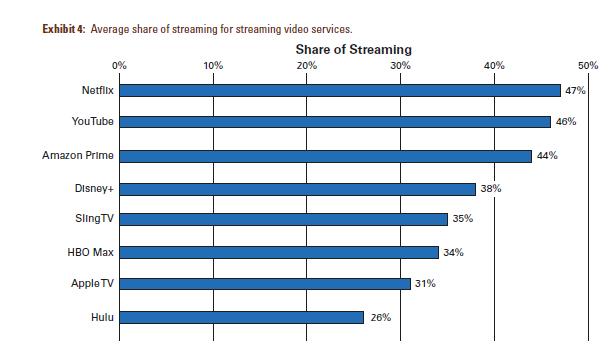
Exhibits 1–6 show the results of these various key performance indicators (KPIs). The Net Promoter Score results supported the perception that the HBO Max launch was disappointing.
HBO Max had the second lowest NPS score (−10) among the eight services investigated. As expected, market leaders Netflix (37) and Amazon Prime (32) produced the best NPS scores.
The number of active subscribers was best approximated by the penetration rate (the percentage of respondents who use the service at least once a month). It provided a slightly different story than the NPS—YouTube (58%) proved to be the most commonly used service. This finding likely reflected the nature of the service (free) more than user preferences.
HBO Max again delivered relatively disappointing performance, with only 18% of users having reported that they used the service, compared to 50% or more for YouTube and Amazon Prime.
The wallet allocation rule (WAR) results were somewhat more encouraging for HBO Max, with the service scoring in the top half of the brands.
Share of streaming (based on percentage of minutes streaming) put Netflix (47%), YouTube (46%), and Amazon Prime (44%) among the leaders. Five months following its launch, HBO Max garnered only one-third (34%) of the share of streaming among its customers.
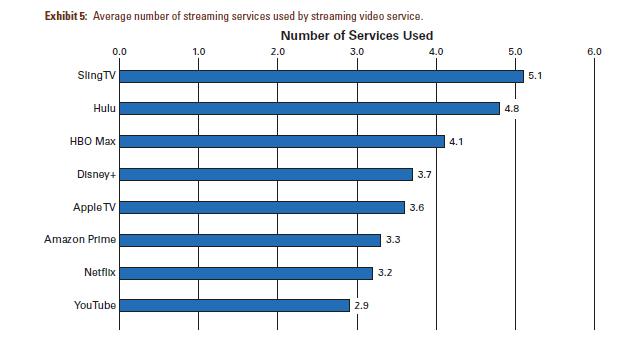
YouTube, Netflix, and Amazon Prime users tended to use approximately three streaming services regularly, while HBO Max users more usually use four. Hulu and Sling TV users tend toward five services (Note: Hulu is frequently bundled with Disney+). As such, HBO Max was positioned somewhere between a “core” streaming service and what might be better characterized as an “add-on.”
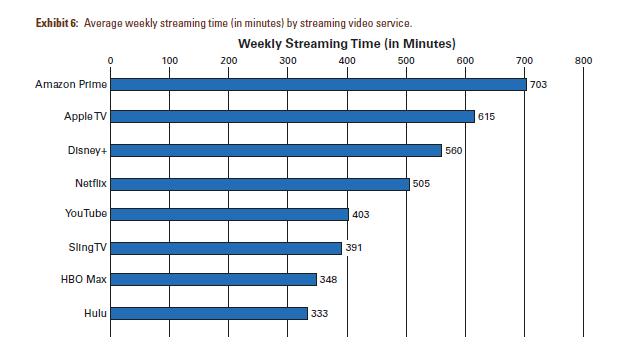
HBO Max users tended to spend less time streaming overall (across all services) compared to users of the leading services, especially Amazon Prime, whose users spent approximately double the time streaming video compared to the average HBO Max user. Given the relationship between HBO Max and its parent/sister companies (HBO, DirecTV), it was possible that HBO Max users made more use of traditional cable/satellite television services, which may have accounted for some of the gap.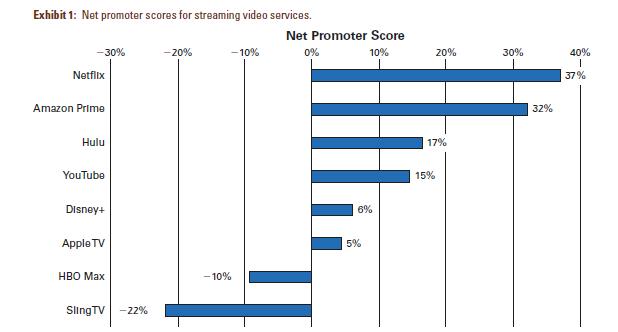
DISCUSSION QUESTIONS
1. What insights does a wallet allocation rule approach provide that are not available through traditional measures designed to gauge customer satisfaction (e.g., NPS, customer satisfaction)?
2. Why is it important that a KPI should have a strong linkage to business outcomes?
3. Why is share of streaming important even if the amount of time a user accesses the service does not directly impact revenue?
Step by Step Answer:


