

Assessing the effect of LIFO versus FIFO on the financial statements. Exhibit 7.16 summarizes data taken from
Question:
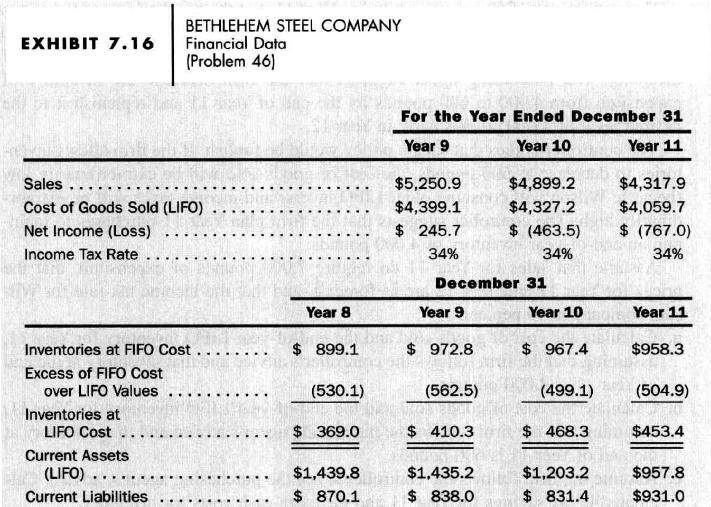
Assessing the effect of LIFO versus FIFO on the financial statements. Exhibit 7.16 summarizes data taken from the financial statements and notes for Bethlehem Steel Company for three years (in millions):
a. Compute the amount of cost of goods sold for Year 9, Year 10, and Year 11, assuming that Bethlehem Steel Company had used a FIFO instead of a LIFO cost flow assumption.
b. Compute the cost of goods sold divided by sales percentages for Year 9, Year 10, and Year 11, using both LIFO and FIFO cost flow assumptions.
c. Refer to part
b. Explain the rank-ordering of the cost of goods sold percentages for each year-that is, why does the LIFO percentage exceed the FIFO percentage or vice versa? (Hint: attempt to ascertain the direction of the change in inventory quantities and manufacturing costs each year.)
d. Compute the inventory turnover ratios (cost of goods sold divided by average inventories) for Year 9, Year 10, and Year 11, using both a LIFO and a FIFO cost flow assumption.
e. Which inventory turnover ratio in part \(\mathbf{d}\) more accurately measures the actual inventory turnover rate? Explain your reasoning.
f. Compute the current ratio (current assets divided by current liabilities) at the end of each year using both LIFO and FIFO cost flow assumptions. Assume that the extra income taxes paid if the firm had used FIFO result in a reduction in cash. (Hint: the adjustment for income taxes must reflect the cumulative income tax effect between the date that Bethlehem Steel Company adopted LIFO and each year-end, not just the additional taxes payable each year.)
g. Assess the short-term liquidity risk of Bethlehem Steel Company to the extent permitted by the information presented in this problem.
Step by Step Answer:


Financial Accounting An Introduction To Concepts Methods And Uses
ISBN: 9780324183511
10th Edition
Authors: Clyde P. Stickney, Roman L. Weil
