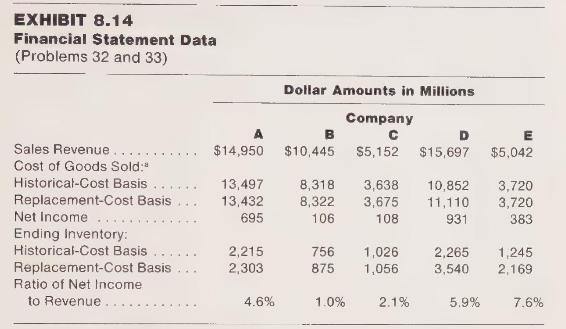
Data for companies A, B, and C shown in Exhibit 8.14 are taken from the annual reports
Question:
Data for companies A, B, and C shown in Exhibit 8.14 are taken from the annual reports of three actual companies in the same industry for a recent year. One of these companies uses a LIFO cost-flow assumption for 100 percent of its inventories, another uses LIFO for about 60 percent of its inventories, and the other uses LIFO for about 45 percent of its inventories. From these data and the lessons of this chapter, answer the following questions, making explicit the reasoning used in each case.

a From the cost-of-goods-sold data alone, which of the companies appears to be the 100 -percent LIFO company? The 60 -percent LIFO company? The 45 -percent LIFO company?
b From the ending-inventory data alone, which of the companies appears to be the 100percent LIFO company? The 60 -percent LIFO company? The 40 -percent LIFO company?
c From your answers to parts a and \(\mathbf{b}\), draw a conclusion as to which of the companies appears to be which.
d Note that Company A earned net income equal to 4.6 percent of sales, whereas Company B earned net income equal to 1.0 percent of sales. Can you conclude that Company A is more profitable than Company B? Why or why not? (Hint: Refer to the data and discussion in Problem 32 of Chapter 6.)
e Although all three of these companies are from the same industry, the nature of the goods sold and the operations of two of the companies are somewhat different from the nature of the goods sold and the operations of the third. Which of the three appears to be the one that is different from the other two?
Step by Step Answer:

Financial Accounting An Introduction To Concepts Methods And Uses
ISBN: 9780030452963
2nd Edition
Authors: Sidney Davidson, Roman L. Weil, Clyde P. Stickney


