Question:
Asian Paints was set up in the year 1942 and is India’s leading paint company with a group turnover of ₹ 170.85 billion. The group has an enviable reputation in the corporate world for professionalism, fast track growth, and building shareholder equity. Asian Paints operates in 16 countries and has 24 paint manufacturing facilities in the world servicing consumers in over 65 countries. Besides Asian Paints, the group operates around the world through its subsidiaries Berger International Limited, Apco Coatings, SCIB Paints, Taubmans and Kadisco. Asian Paints manufactures wide range of paints for decorative and industrial use.
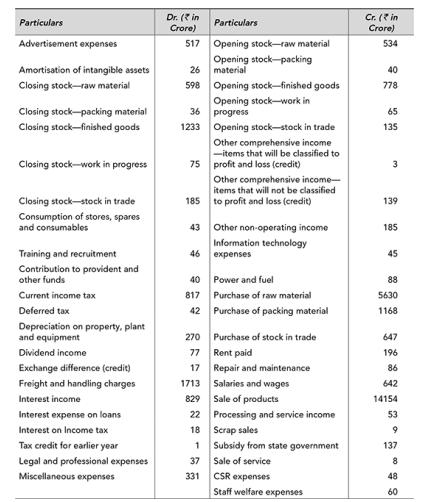
Based upon the following particulars prepare the statement of profit and loss of the company for the year 2016–17.


Transcribed Image Text:
Particulars
Advertisement expenses
Amortisation of intangible assets
Closing stock-raw material
Closing stock-packing material
Closing stock-finished goods
Closing stock-work in progress
Closing stock-stock in trade
Consumption of stores, spares
and consumables
Training and recruitment
Contribution to provident and
other funds
Current income tax
Deferred tax
Depreciation on property, plant
and equipment
Dividend income
Exchange difference (credit)
Freight and handling charges
Interest income
Interest expense on loans
Interest on Income tax
Tax credit for earlier year
Legal and professional expenses
Miscellaneous expenses
Dr. (in
Crore)
Particulars
517 Opening stock-raw material
Opening stock-packing
material
26
598
36
1233
Opening stock-stock in trade
Other comprehensive income
-items that will be classified to
75 profit and loss (credit)
185
46
Opening stock-finished goods
Opening stock-work in
progress
43 Other non-operating income
Information technology
expenses
270
77
17
1713
829
22
18
Other comprehensive income-
items that will not be classified
to profit and loss (credit)
40
Power and fuel
817 Purchase of raw material
42
1
37
331
Purchase of packing material
Purchase of stock in trade
Rent paid
Repair and maintenance
Salaries and wages
Sale of products
Processing and service income
Scrap sales
Subsidy from state government
Sale of service
CSR expenses
Staff welfare expenses
Cr. (in
Crore)
534
40
778
65
135
3
139
185
45
88
5630
1168
647
196
86
642
14154
53
9
137
8
48
60

![]()


