Question:
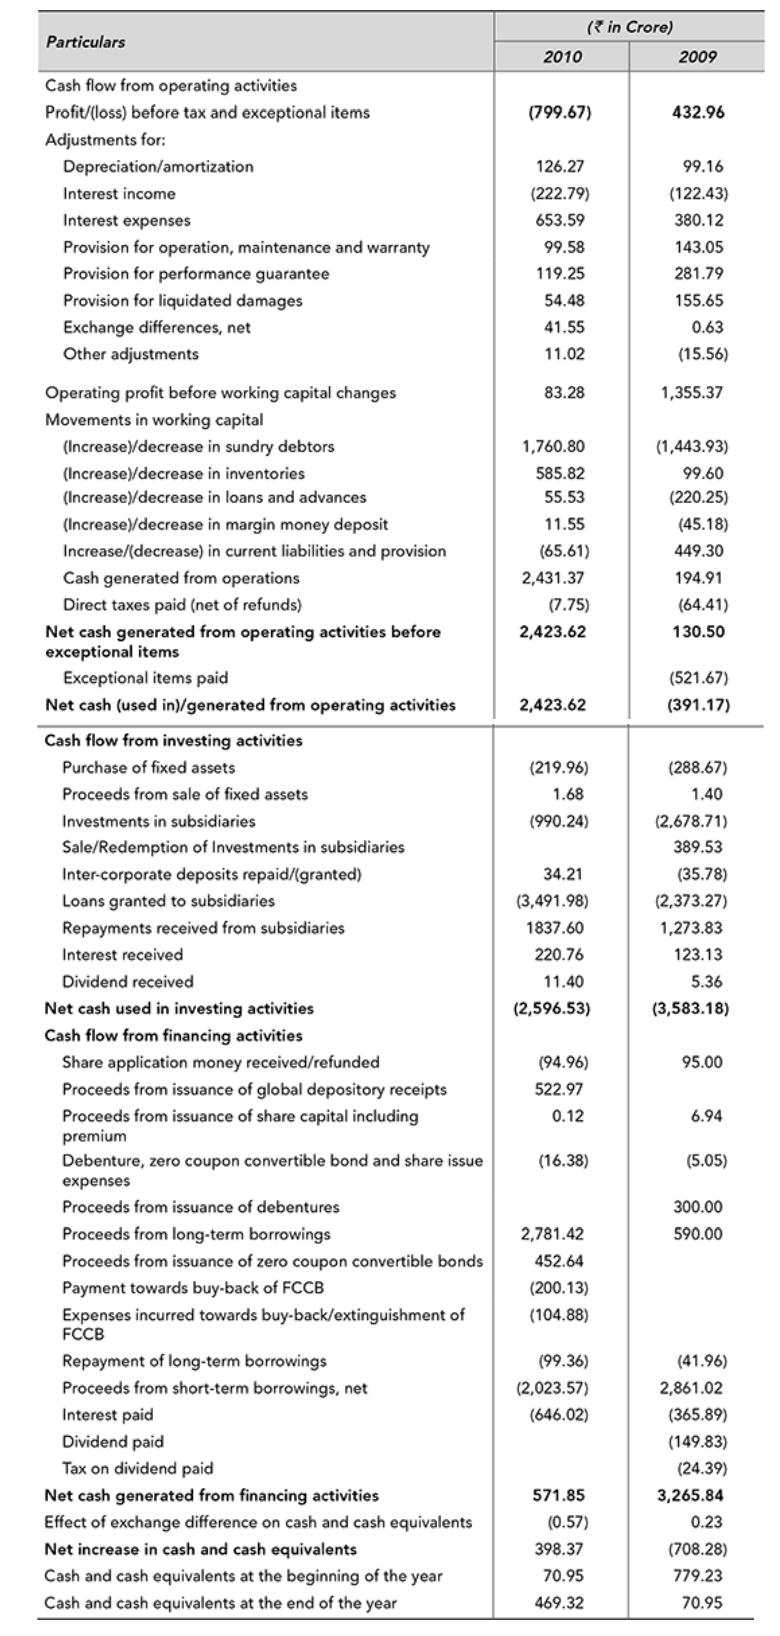
Suzlon Energy Limited, founded in the year 1995, is a leading wind power company. It has presence in 21 countries in the continents of America, Asia, Australia and Europe. It has emerged as the third largest wind power supplier. The year 2009–10 proved to be a disappointing year for Suzlon as it suffered its first full year loss. The economic downturn had a significant impact on lowering demand—and therefore the relative price—of energy. During these difficult times, the company’s management of cash is depicted in the cash flow statements for the year 2008–09 and 2009–10 as follows.
Cash Flow Statement for the Year Ended 31st March

Questions for Discussion
1. For the year 2009, the company earned a profit before tax of ₹ 432.96 crore but its cash flow from operating activities was negative (−₹ 391.17 crore). In the next year, the company suffered a loss (−₹ 799.67 crore) but the cash flow from operating activities was positive ( ₹ 2,423.62 crore). Identify the main reasons for the same.
2. What has happened to debtors’ position in the year 2009 and 2010?
3. Indentify and analyse major uses of cash towards investing activities.
4. Analyse the major financing activities of Suzlon during 2009 and 2010.
Transcribed Image Text:
Particulars
Cash flow from operating activities
Profit/(loss) before tax and exceptional items
Adjustments for:
Depreciation/amortization
Interest income
Interest expenses
Provision for operation, maintenance and warranty
Provision for performance guarantee
Provision for liquidated damages
Exchange differences, net
Other adjustments
Operating profit before working capital changes
Movements in working capital
(Increase)/decrease in sundry debtors
(Increase)/decrease in inventories
(Increase)/decrease in loans and advances
(Increase)/decrease in margin money deposit
Increase/(decrease) in current liabilities and provision
Cash generated from operations
Direct taxes paid (net of refunds)
Net cash generated from operating activities before
exceptional items
Exceptional items paid
Net cash (used in)/generated from operating activities
Cash flow from investing activities
Purchase of fixed assets
Proceeds from sale of fixed assets
Investments in subsidiaries
Sale/Redemption of Investments in subsidiaries
Inter-corporate deposits repaid/(granted)
Loans granted to subsidiaries
Repayments received from subsidiaries
Interest received
Dividend received
Net cash used in investing activities
Cash flow from financing activities
Share application money received/refunded
Proceeds from issuance of global depository receipts
Proceeds from issuance of share capital including
premium
Debenture, zero coupon convertible bond and share issue
expenses
Proceeds from issuance of debentures
Proceeds from long-term borrowings
Proceeds from issuance of zero coupon convertible bonds
Payment towards buy-back of FCCB
Expenses incurred towards buy-back/extinguishment of
FCCB
Repayment of long-term borrowings
Proceeds from short-term borrowings, net
Interest paid
Dividend paid
Tax on dividend paid
Net cash generated from financing activities
Effect of exchange difference on cash and cash equivalents
Net increase in cash and cash equivalents
Cash and cash equivalents at the beginning of the year
Cash and cash equivalents at the end of the year
2010
(799.67)
( in Crore)
126.27
(222.79)
653.59
99.58
119.25
54.48
41.55
11.02
83.28
1,760.80
585.82
55.53
11.55
(65.61)
2,431.37
(7.75)
2,423.62
2,423.62
(219.96)
1.68
(990.24)
34.21
(3,491.98)
1837.60
220.76
11.40
(2,596.53)
(94.96)
522.97
0.12
(16.38)
2,781.42
452.64
(200.13)
(104.88)
(99.36)
(2,023.57)
(646.02)
571.85
(0.57)
398.37
70.95
469.32
2009
432.96
99.16
(122.43)
380.12
143.05
281.79
155.65
0.63
(15.56)
1,355.37
(1,443.93)
99.60
(220.25)
(45.18)
449.30
194.91
(64.41)
130.50
(521.67)
(391.17)
(288.67)
1.40
(2,678.71)
389.53
(35.78)
(2,373.27)
1,273.83
123.13
5.36
(3,583.18)
95.00
6.94
(5.05)
300.00
590.00
(41.96)
2,861.02
(365.89)
(149.83)
(24.39)
3,265.84
0.23
(708.28)
779.23
70.95


