

Net operating profit margin (NOPM) and net operating asset turnover (NOAT) for several selected companies for 2007
Question:
Net operating profit margin (NOPM) and net operating asset turnover (NOAT) for several selected companies for 2007 follow.
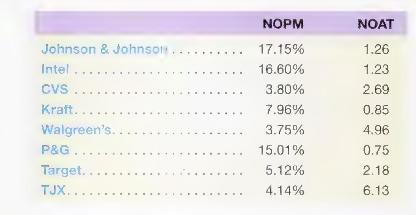
a. Graph NOPM and NOAT for each of these companies. Do you see a pattern that is similar to that shown in this module? Explain. (The graph in the module is based on medians for selected industries; the graph for this problem uses fewer companies than in the module and, thus, will not be as smooth.)
b. Consider the trade-off between profit margin and asset tumover. How can we evaluate companies on the profit margin and asset turnover trade-off? Explain.
Step by Step Answer:

This question has not been answered yet.
You can Ask your question!
Related Book For 
Financial Accounting For MBAs
ISBN: 9781934319345
4th Edition
Authors: Peter D. Easton, John J. Wild, Robert F. Halsey, Mary Lea McAnally
Question Posted:
