Question:
Refer to Apple Inc.’s consolidated financial statements in Appendix A and online in the filings section of www.sec.gov.
Requirements
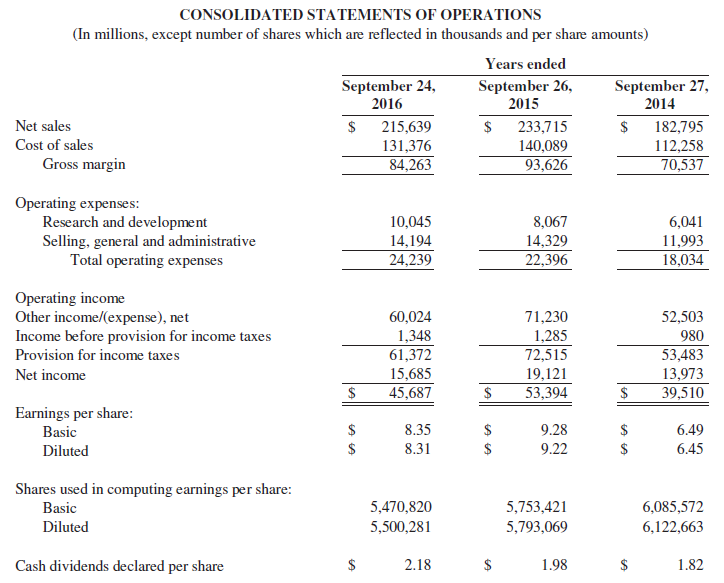
1. Examine Note 5—Income Taxes—in the Notes to Consolidated Financial Statements. Income tax provision is another title for income tax expense. What was Apple’s income tax provision in 2016? Is the income tax provision likely to be equal to the amount Apple paid for its taxes in 2016? Why or why not? What was the company’s effective tax rate in 2016?
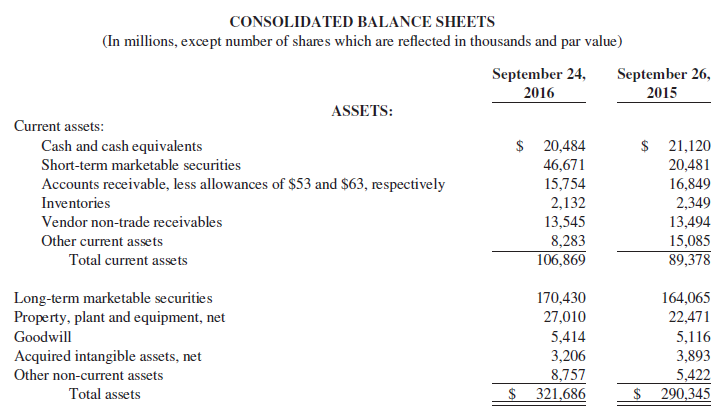
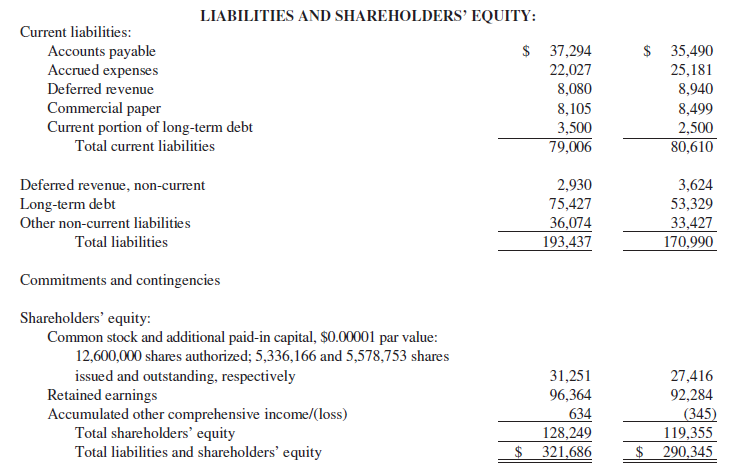
2. Examine Note 6—Debt. Did Apple borrow more or pay off more long-term debt during 2016? How can you tell? What was the company’s effective interest rate on its long-term debt? Why do you think the rate was so low? (Challenge)
3. How would you rate Apple’s overall debt position—risky, safe, or average? Compute three ratios at September 24, 2016, and September 26, 2015, that help answer this question.
Data from Apple Inc.'s
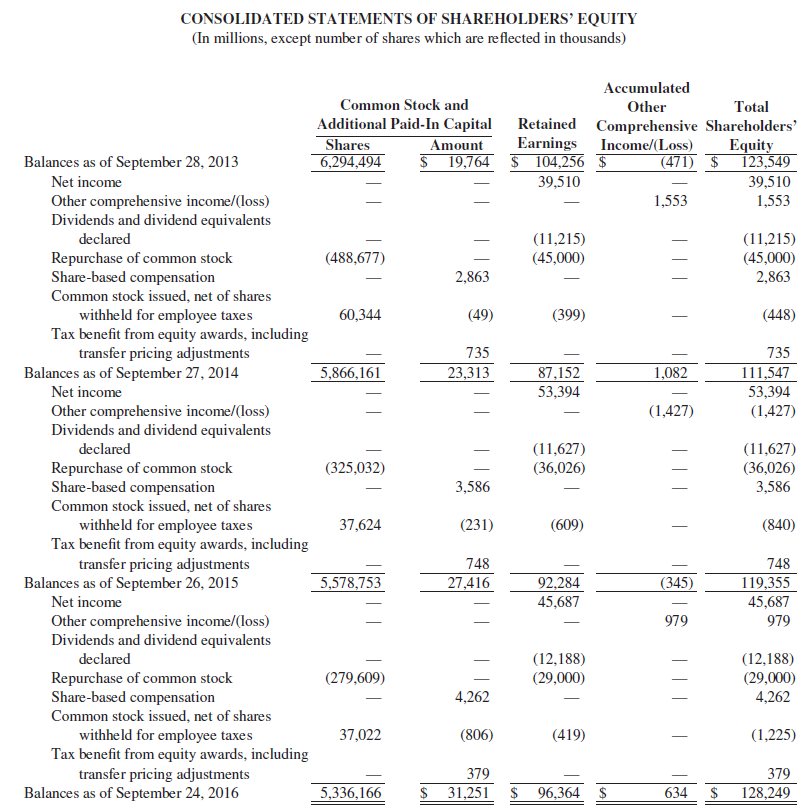
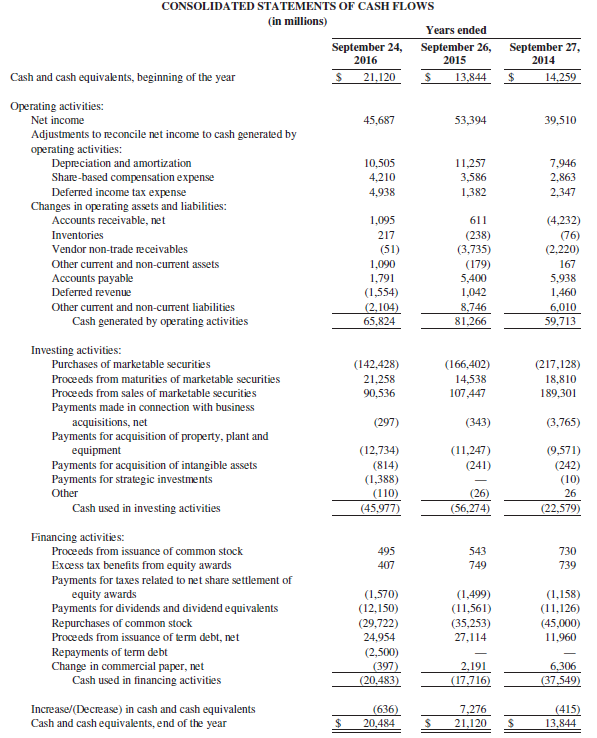
Financial Statements
Financial statements are the standardized formats to present the financial information related to a business or an organization for its users. Financial statements contain the historical information as well as current period’s financial...
Transcribed Image Text:
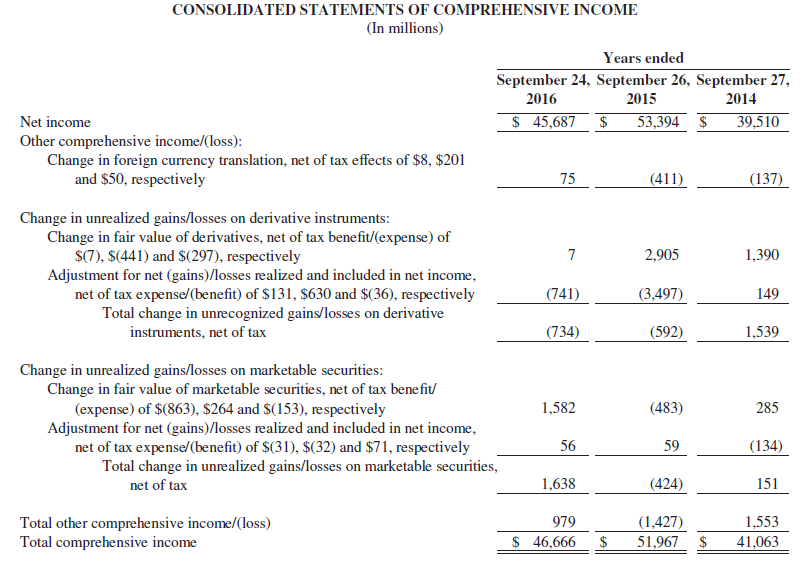
CONSOLIDATED STATEMENTS OF OPERATIONS (In millions, except number of shares which are reflected in thousands and per share amounts) Years ended September 26, 2015 September 24, 2016 September 27, 2014 Net sales 215,639 131,376 84,263 233,715 140,089 93,626 182,795 Cost of sales 112,258 70,537 Gross margin Operating expenses: Research and development Selling, general and administrative Total operating expenses 6,041 10,045 14,194 24,239 8,067 14,329 22,396 11,993 18,034 Operating income Other income/(expense), net Income before provision for income taxes 60,024 1,348 61,372 71,230 1,285 72,515 52,503 980 53,483 Provision for income taxes 19,121 15,685 45,687 13,973 Net income 53,394 39,510 Earnings per share: Basic 2$ 8.35 9.28 6.49 8.31 9.22 6.45 Diluted Shares used in computing earnings per share: Basic 5,470,820 5,753,421 6,085,572 5,500,281 Diluted 5,793,069 6,122,663 Cash dividends declared per share 2.18 1.98 1.82 %24 CONSOLIDATED STATEMENTS OF COMPREHENSIVE INCOME (In millions) Years ended September 24, September 26, September 27, 2016 2015 2014 Net income $ 45,687 53,394 $ 39,510 Other comprehensive income/(loss): Change in foreign currency translation, net of tax effects of $8, $201 and $50, respectively 75 (411) (137) Change in unrealized gains/losses on derivative instruments: Change in fair value of derivatives, net of tax benefit/(expense) of $7), $(441) and $(297), respectively Adjustment for net (gains)/losses realized and included in net income, net of tax expense/(benefit) of $131, $630 and $(36), respectively Total change in unrecognized gains/losses on derivative 2,905 1,390 (741) (3,497) 149 instruments, net of tax (734) (592) 1,539 Change in unrealized gains/losses on marketable securities: Change in fair value of marketable securities, net of tax benefit/ (expense) of $(863), $264 and $(153), respectively Adjustment for net (gains)/losses realized and included in net income, net of tax expense/(benefit) of $(31), $(32) and $71, respectively Total change in unrealized gains/losses on marketable securities, 1,582 (483) 285 56 59 (134) net of tax 1,638 (424) 151 979 (1,427) 1,553 Total other comprehensive income/(loss) Total comprehensive income $ 46,666 51,967 $ 41,063


