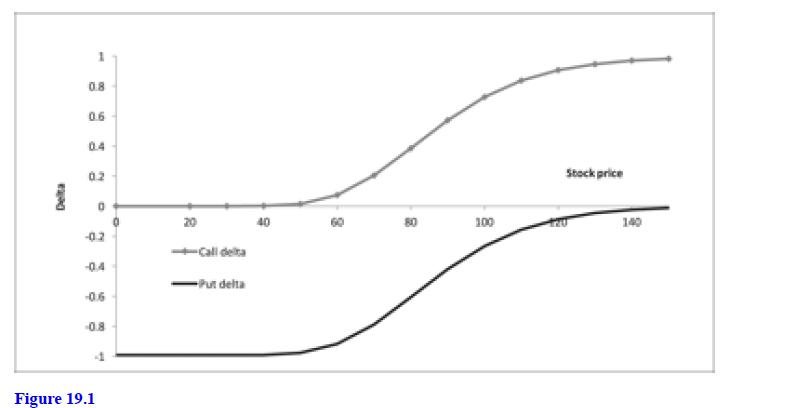
Produce a graph similar the second panel of figure 19.1 for puts. Delta 1 08 0.6 0.4
Question:
Produce a graph similar the second panel of figure 19.1 for puts.

Transcribed Image Text:
Delta 1 08 0.6 0.4 0.2 D -0.2 -0.4 -0.6 -0.8 Figure 19.1 20 -Call delta -Put delta 40 8 Stock price 80 100 120 140
Step by Step Answer:

This question has not been answered yet.
You can Ask your question!
Related Book For 

Question Posted:
Students also viewed these Business questions
-
Produce a graph similar to the second panel of Figure 18.2 for puts. 1.0 Call Delta, Time to Maturity, and Moneyness 0.9 0.8 0.7 0.6 0.5 0.4 0.3 0.2 - Out of the money At the money 0.1 - In the money...
-
SA-TIED YOUNG SCHOLARS PROGRAMME Young Scholars This paper was produced as a part of the SA-TIED Young Scholars' programme. The programme is a part of SATIED's capacity building initiatives, designed...
-
MATHEMATICS FOR MACHINE LEARNING Marc Peter Deisenroth A. Aldo Faisal Cheng Soon Ong Contents Foreword 1 Part I Mathematical Foundations 9 1 Introduction and Motivation 11 1.1 Finding Words for...
-
Use the test of your choice to determine whether the following series converge. + + +
-
Suppose that a = (a1 an) Rn, that fj: R R for j = 1, 2,..., n, and that g(x1, x2,..., xn) := f1(x1) fn(xn). a) Prove that if fj(t) fj(a) as t aj, for each j = 1,..., n, then g(x) f1(a1) ...
-
Thirty years ago, Starbucks was a single store in Seattles Pike Place Market selling premium-roasted coffee. Today, it is a global roaster and retailer of coffee with more than 24,000 stores, 40% of...
-
Proportion of true negatives
-
Under standard accounting rules, it is possible for a companys liabilities to exceed its assets. When this occurs, the owners equity is negative. Can this happen with market values? Why or why not?
-
3 Please help me my last final, I need the answer as quick as possible only have 1 hour Complete the variance analysis table below by: calculating the variance $ calculating the variance % to 2...
-
Figure 19.2 shows the call theta as a function of time to maturity. Produce a similar graph for puts. Theta 6543NHO12 5 -6 -8 -9 -10 -11 -12 Stock price 20 40 80 100 120 140 -Call theta -Put theta...
-
Note that you can also calculate the Black-Scholes put option premium as a percentage of the exercise price in terms of S/X: a. Implement this in a spreadsheet or R. b. Find the ratio of S/X for...
-
Calculate the thermal conductivities of (a) Neon, (b) Nitrogen at 300 K and 15 mbar. Each gas is confined in a cubic vessel of side 15 cm, one wall being at 305 K and the one opposite at 295 K. What...
-
The relationship between income and savings, let's look back to the recent credit crisis that sent our economy into the greatest financial crisis since the Great Depression. Watch this short video...
-
Jos Lpez has $15,000 in a 6-year certificate of deposit (CD) that pays a guaranteed annual rate of 4%. Create a timeline showing when the cash flows will occur. (6 points) 2. Oliver Lpez deposits...
-
PROBLEM SET #2 At a large urban college, about half of the students live off campus in various arrangements, and the other half live on campus. Is academic performance dependent on living...
-
Post a compelling argument stating whether leaders are born, made, or a combination of both. Drawing from the discussion of the two current peer-reviewed articles you identified, support your...
-
Unicorn Inc. builds commercial jets and calculate the cost for each jet. For each item below, indicate whether it would be most likely classified as direct labor (DL); direct materials (DM);...
-
The Department of Homeland Security conducted a bottom-up review (BUR) in conjunction with the Quadrennial Homeland Security Review (QHSR) to determine the status of Americas homeland security...
-
The following exercises are not grouped by type. Solve each equation. x610x -9
-
Nelo Partnership had three partners, whose capital balances on June 30 were as follows: Jack $50,000, Andy $35,000, Nick $22,000. The profit-sharing ratio is 6:4:2 (Jack, Andy, Nick). On July 1,...
-
Alex buys a Blu-ray disc costing $14.49. Use the table below to find the sales tax on this item. Amount of Sale ($) Tax ($) 13.70 13.89 0.69 13.90 14.09 0.70 14.10 14.29 0.71 14.30 14.49 0.72 14.50...
-
Show partial income statements through gross margin for all three methods, assuming both products are further processed into Current Attempt in Progress It's mind - boggling the number of products...

Study smarter with the SolutionInn App


