

The following cash-fl ow pattern has two IRRs. Use Excel to draw a graph of the NPV
Question:
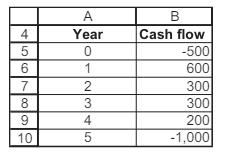
The following cash-fl ow pattern has two IRRs. Use Excel to draw a graph of the NPV of these cash fl ows as a function of the discount rate. Then use the IRR function to identify the two IRRs. Would you invest in this project if the opportunity cost were 20 percent?
Step by Step Answer:

This question has not been answered yet.
You can Ask your question!
Related Book For 

Question Posted:
