

The following chart shows the variance-covariance matrix and the mean returns for six stocks. All the data
Question:
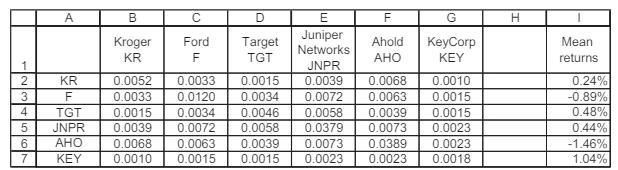
The following chart shows the variance-covariance matrix and the mean returns for six stocks. All the data are for monthly data (raw data are on the disk with the book).
a. Compute the global minimum variance portfolio (GMVP).
b. Compute the effi cient portfolio, assuming a monthly risk-free rate of 0.45%.
c. Show the frontier as the expected return and standard deviation of convex combinations of the GMVP and the efficient portfolio.
Fantastic news! We've Found the answer you've been seeking!
Step by Step Answer:

Answered By
Kennedy Odhiambo
As a professional writer, I have been in the field for over 5 years having worked as a lecture in different tertiary institutions across the world. With this impeccable experience, I assure provision of a good and supporting environment for students to learn.
2+ Reviews
10+ Question Solved
Related Book For 
Question Posted:
