Question:
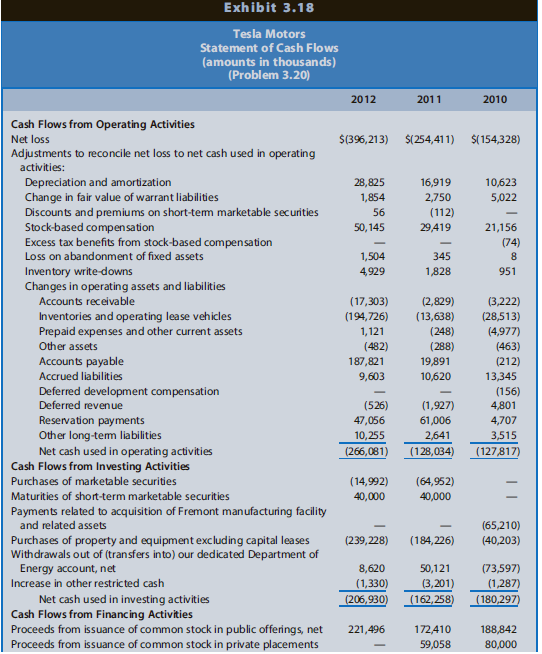
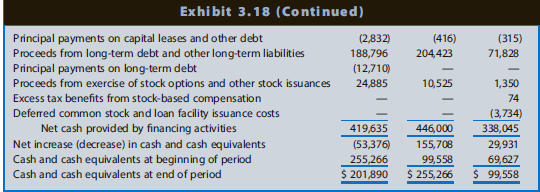
Tesla Motors manufactures high-performance electric vehicles that are extremely slick looking. Exhibit 3.18 presents the statement of cash flows for Tesla Motors for 2010 through 2012.
REQUIRED
Discuss the relations among net income, cash flows from operations, cash flows from investing activities, and cash flows from financing activities for the firm over the three-year period. Speculate on the reasons for significant adjustments on the statement of cash flows. Describe what stage of life cycle these relations suggest for Tesla Motors. Why are negative operating cash flows less than the net losses? Where is Tesla obtaining cash, and what is it doing with it? What do you think will happen with cash flows in 2013?


Transcribed Image Text:
Exhibit 3.18 Tesla Motors Statement of Cash Flows (amounts in thousands) (Problem 3.20) 2012 2011 2010 Cash Flows from Operating Activities Net loss $(396,213) $(254,411) $(154,328) Adjustments to reconcile net loss to net cash used in operating activities: Depreciation and amortization Change in fair value of warrant liabilities Discounts and premiums on short-tem marketable securities Stock-based compen sation 28,825 16,919 10,623 1,854 2,750 5,022 56 (112) 50,145 29,419 21,156 Excess tax benefits from stock-based compensation (74) Loss on abandonment of fixed assets 1,504 345 1,828 Inventory write-downs Changes in operating assets and liabilities 4,929 951 Accounts receivable (17,303) (2,829) (3,222) Inventories and operating lease vehicles (194,726) 1,121 (482) (13,638) (28,513) Prepaid expenses and other current assets (248) (4,977) Other assets (288) (463) Accounts payable 187,821 19,891 (212) Accrued liabilities 9,603 10,620 13,345 Deferred development compensation (156) 4,801 Deferred revenue (526) (1,927) Reservation payments Other long-tem liabilities Net cash used in operating activities Cash Flows from Investing Activities 47,056 61,006 4,707 10,255 2,641 3,515 (266,081) (128,034) (127,817) Purchases of marketable securities (14,992) (64,952) Maturities of short-term marketable securities 40,000 40,000 Payments related to acquisition of Fremont manufacturing facility and related assets (65,210) (40,203) Purchases of property and equipment excluding capital leases Withdrawals out of (transfers into) our dedicated Department of Energy account, net (239,228) (184, 226) 8,620 50,121 (73,597) (3,201) (162,258) Increase in other restricted cash (1,330) (1,287) Net cash used in investing activities Cash Flows from Financing Activities Proceeds from issuance of common stock in public offerings, net Proceeds from issuance of common stock in private placements (206,930) (180,297) 221,496 172,410 188,842 59,058 80,000


