Question:
E14.11. A Simple Valuation and Reverse Engineering: IBM (Easy) The following are key numbers from IBM's financial statements for 2004. Net operating assets, end of year Net financial obligations, end of year Common equity, end of year Common shares outstanding, end of year Core return on net operating assets Sales growth rate $42,104 milion 12,357 milion 29,747 milion 1,645.6 milion 18.8% 8.8% IBM's shares traded at $95 when 2004 results were announced. Use a required return for operations of 12.3 percent to answer the following questions:
a. Forecast operating income and residual operating income for 2005 if IBM maintains the same core RNOA as in 2004.
b. Calculate the per-share value of the equity if IBM were to maintain this profitability in the future and if residual earnings were to grow at the 2004 sales growth rate. Also calculate the implied forward enterprise P/E ratio and the enterprise P/B ratio.
c. Calculate the expected rate of return on buying IBM's stock at 595 under the scenario in part
b. is $95 cheap or expensive?
d. What growth rate in residual operating income would justify the current stock price if you were sure that 12.3 percent was a reasonable required return?
 Real World Connection Exercises E6.9 and E13.14 deal with IBM, as does Minicase M12.3.
Transcribed Image Text:
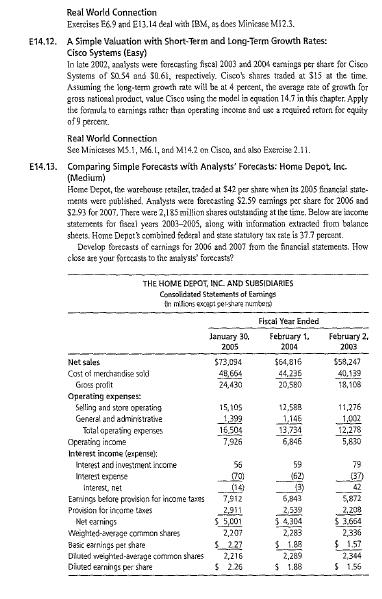
Real World Connection Exercises E6.9 and E13.14 deal with IBM, as does Minicase M12.3. E14.12. A Simple Valuation with Short-Term and Long-Term Growth Rates: Cisco Systems (Easy) In late 2002, analysts were forecasting fiscal 2003 and 2004 eanings per share for Cisco Systems of $0.54 and $0.61, respectively. Cisco's shares traded at $15 at the time. Assuming the long-term growth rate will be at 4 percent, the average rate of growth for gross national product, value Cisco using the model in equation 14.7 in this chapter. Apply the formula to earnings rather than operating income and use a required retorn for equity of 9 percent. Real World Connection See Minicases M5.1, M6.1, and M14.2 on Cisco, and also Exercise 2.11. E14.13. Comparing Simple Forecasts with Analysts' Forecasts: Home Depot, Inc. (Medium) Home Depot, the warehouse retailer, traded at $42 per share when its 2005 financial state- ments were published. Analysts were forecasting $2.59 earnings per share for 2006 and $2.93 for 2007. There were 2,185 million shares outstanding at the time. Below are income statements for fiscal years 2003-2005, along with information extracted from balance sheets. Home Depot's combined federal and state statutory tax rate is 37.7 percent. Develop forecasts of earnings for 2006 and 2007 from the financial statements. How close are your forecasts to the analysts' forecasts? THE HOME DEPOT, INC. AND SUBSIDIARIES Consolidated Statements of Earnings In milions except per-share number Fiscal Year Ended January 30, February 1. February 2, 2005 2004 2003 Net sales $73,094 $64,816 $58,247 Cost of merchandise sold 48,664 44,236 40,139 Gross profit 24,430 20,580 18,108 Operating expenses: Selling and store operating 15,105 12,588 11,276 General and administrative 1,399 1,146 1,002 Total operating experses 16,504 13,734 12.278 Operating income 7,926 6,846 5,830 Interest income (expense): Interest and investment income 56 59 79 Interest expense (70) (62) (37) Interest, net (14) 43) 42 Earings before provision for income taxes 7,912 6,843 5,872 Provision for income taxes 2,911 2,539 2,208 Net earnings $ 5,001 $ 4,304 $ 3,664 Weighted-average common shares 2,207 Basic earnings per share $2.27 Diluted weighted-average common shares Diluted earnings per share 2,216 2,283 $1.88 2,289 $ 2.26 $ 1.88 2,336 $1.57 2,344 $ 1.56
 Real World Connection Exercises E6.9 and E13.14 deal with IBM, as does Minicase M12.3.


