

E19.5. Tracking Credit Risk Measures: Toys R Us (Hard) Toys R Us, Inc., is the world's largest
Question:
E19.5. Tracking Credit Risk Measures: Toys "R" Us (Hard) Toys "R" Us, Inc., is the world's largest toy retailer, with sales of nearly $12 billion in 1999. It has been challenged in recent years, particularly in e-commerce, losing market share from 20.2 percent in 1993 to 16.8 percent in 1999. The firm's stock price was down to $11 in early 2000 from a high of $36 in 1998. Management had begun, however, to take strate- gic initiatives to return the firm to the leading position it once enjoyed, The firm's balance sheets and income statements for fiscal years ending January of 1997 to 2000 are given in Exhibit 19.1, along with share price and shares outstanding informa- tion. Track the profitability of the firm over the years and also its creditworthiness, as indi- cated by relevent ratios and Z-scores.
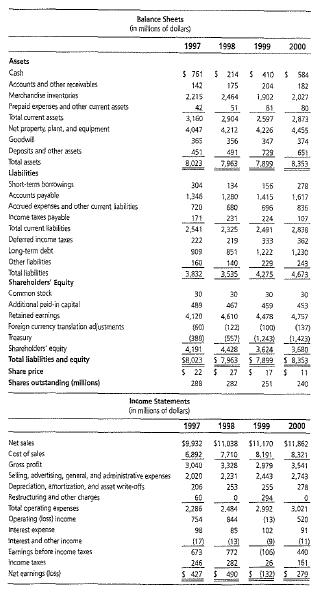 Balance Sheets ( milions of dollars) 1997 1998 1999 2000 Assets Cash $ 761 Accounts and other receivables 142 175 5 214 5410 $ 584 204 Merchandise inventories 2.215 2,464 1,902 Prepaid experses and other current assets 42 51 81 Total current assets 3,160 2,904 2.597 Not property, plant, and equipment 4,047 4,212 4226 Goodwill 355 356 347 Deposits and other assets 451 491 729 Total assets 8,023 7,963 7.899 Liabilities Short-term borrowings 304 134 155 Accounts payable 1,346 1,280 1,415 Accrued expenses and other current abilities 720 680 696 Income taxes payable 171 231 224 Total current liabilities 2,541 2,325 2.491 Deferred income taxes Long-term debe Other abilities 222 219 333 509 851 1,222 160 140 229 Total liabilities Shareholders' Equity Common stock Additional paid-in capital Retained earnings 3,832 3.535 4,225 30 30 30 489 467 459 4,120 4,610 4,478 Foreign currency translation adjustments (600 (122) (100) Treasury (385) 1557) (1,243) Shareholders' equity 4,191 4,428 3624 Total liabilities and equity $8,023 $ 7,963 $ 7,899 $8,353 R 80 Share price Shares outstanding (millions) $ 22 288 $ 27 $ 17 282 251 Income Statements (in millions of dollars) 1997 1998 1999 2000 Net sales Cost of sales Gross profit 6292 3,040 $9.932 $11,038 7,710 3,328 2.979 3,541 $11,170 $11.862 8,191 8.321 Seling, advertising, general, and administrative expenses Depreciation, amortization, and asset write-offs 2,020 2,231 2,443 2,743 206 253 255 278 Restructuring and other charges Total operating expenses Operating (loss) income Interest expense interest and other income 60 0 294 0 2,286 2.484 2.992 3.021 754 844 (13) 520 98 85 102 a 91 (13) (13) (9) (11) income taxes Earnings before income taxes Net earnings (loss) 673 772. (106) 440 246 282 25 151 $ 427 $ 490 $ (132) $279
Step by Step Answer:


Financial Statement Analysis And Security Valuation
ISBN: 9780071267809
4th International Edition
Authors: Penman-Stephen-H, Steven Penman
