Question:
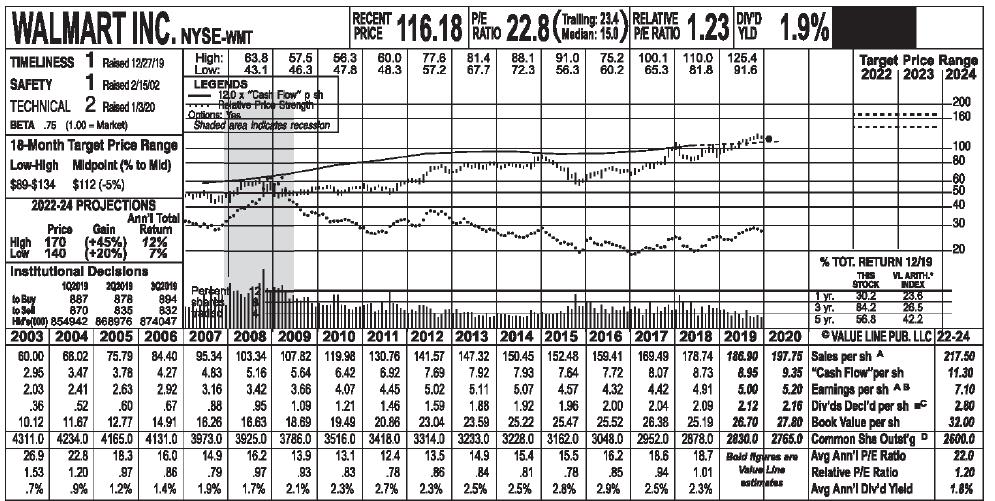
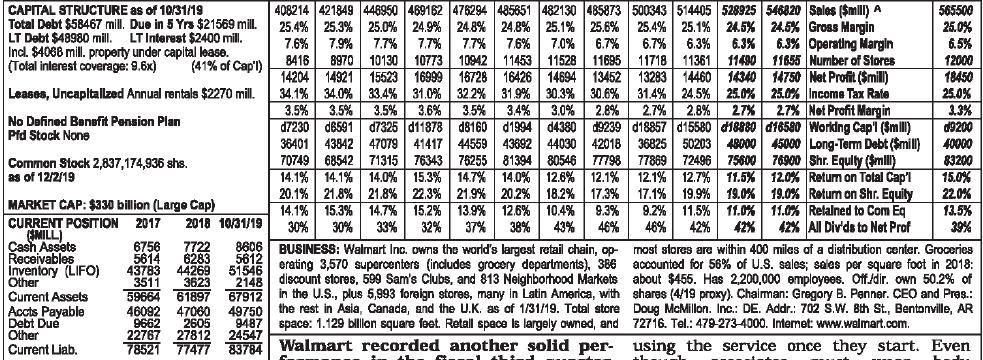
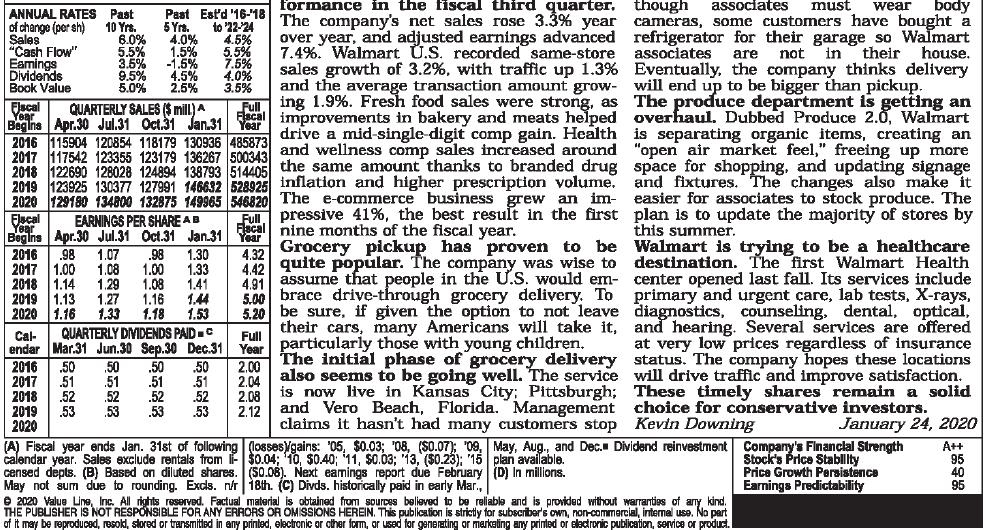
This chapter stressed the importance of evaluating potential investments. Now it’s your turn to try your skill at evaluating a potential investment in the Walmart Corporation. Assume you could invest $10,000 in the common stock of this company. To help you evaluate this potential investment, carefully examine Exhibit 14-7, which reproduces the research report on Walmart from Value Line.
The report was published on January 24, 2020.


Questions
1. Based on the research provided by Value Line, would you buy Walmart’s stock? Justify your answer.
2. What other investment information would you need to evaluate Walmart's common stock? Where would you obtain this information?
3. On January 24, 2020, Walmart’s common stock was selling for $116 a share. Using the internet, determine the current price for a share of Walmart’s common stock. Based on this information, would your investment have been profitable if you had purchased the common stock for $116 a share?
4. Assuming you purchased Walmart’s stock on January 24, 2020, and based on your answer to question 3, would you want to hold or sell your Walmart stock? Explain your answer.
Transcribed Image Text:
WALMART INC. NYSE-WHIT
TIMELINESS 1 Raised 12/27/19
SAFETY
1 Raised 2/15/02
TECHNICAL 2 Raised 1/3/20
BETA 75 (1.00- Market)
18-Month Target Price Range
Low-High Midpoint (% to Mid)
$89-$134 $112 (-5%)
2022-24 PROJECTIONS
Ann'l Total
Price
Gain Return
High 170 (+45%) 12%
Low 140
(+20%) 7%
Institutional Decisions
to Buy
to Sell
High: 63.8 57.5 56.3
43.1 46.3 47.8
Low:
LEGENDS
- 120 x "Cash Flow" p sh
Relative Price Strength
Options: Yes
Shaded area indicates recession
***
Perbent
sblattts.
RECENT
DIV'D
P/E
Tralling: 23.4 RELATIVE
PRET 116.18 RATIO 22.8 (3.0) PRATO 1.23 1.9%
**
..... --سالم
60.0 77.6 81.4 88.1 91.0 75.2 100.1
100.1 110.0 125.4
48.3 57.2 67.7 72.3 56.3 60.2 65.3 81.8 91.6
A
הה" יו
"Th
111.
1.
Target Price Range
2022 2023 2024
1 yr.
3 yr.
5 yr.
‒‒‒‒
-200
-160
% TOT. RETURN 12/19
THIS VL ARITH.*
STOCK INDEX
102019
202019 302019
30.2
23.6
887
894
878
835
84.2
26.5
870
832
H000) 854942 868976 874047AA
toldod
42.2
2010 2011 2012 2013 2014 2015 2016
217.50
11.30
5.20 Earnings per sh AB
7.10
56.8
2003 2004 2005 2006 2007 2008 2009
2017 2018 2019 2020 VALUE LINE PUB. LLC 22-24
60.00 68.02 75.79 84.40 95.34 103.34 107.82 119.98 130.76 141.57 147.32 150.45 152.48 159.41 169.49 178.74 186.90 197.75 Sales per sh A
2.95 3.47 3.78 4.27 4.83 5.16 5.64 6.42 6.92 7.69 7.92 7.93 7.64 7.72 8.07 8.73 8.95 9.35 "Cash Flow"par sh
2.03 2.41 2.63 2.92 3.16 3.42 3.66 4.07 4.45 5.02 5.11 5.07 4.57 4.32 4.42 4.91 5.00
.36 52 .60 .67 .88 .95 1.09 1.21 1.46 1.59 1.88 1.92 1.96 2.00 2.04 2.09 212
10.12 11.67 12.77 14.91 16.26 16.63 18.69 19.49 20.86 23.04 23.59 25.22 25.47 25.52 26.38 25.19 26.70
4311.0 4234.0 4165.0 4131.0 3973.0 3925.0 3786.0 3516.0 3418.0 3314.0 3233.0 3228.0 3162.0 3048.0 2952.0 2878.0 2830.0 2765.0
26.9 22.8 18.3 16.0 14.9 16.2 13.9 13.1 12.4 13.5 14.9 15.4 15.5 16.2 18.6 18.7 Bold figures are
1.53 1.20 97 .86 .79 .97 .93 .83 78 .86 84 81 .78 .85 .94 1.01
.7% .9% 1.2% 1.4% 1.9% 1.7% 2.1% 2.3% 2.7%
2.3% 2.5% 2.5% 2.8% 2.9% 2.5% 2.3%
2.80
32.00
2.16 Div'ds Decl'd per sh
27.80 Book Value per sh
Common She Outsi'g D
Avg Ann'l P/E Ratio
Relative P/E Ratio
2600.0
22.0
1.20
Value Line
estimates
Avg Ann'l Div'd Yield
-100
-80
-60
-50
-40
-30
-20
1.8%


