The annual reports of publicly traded companies describe some of the financial ratios presented in this chapter.
Question:
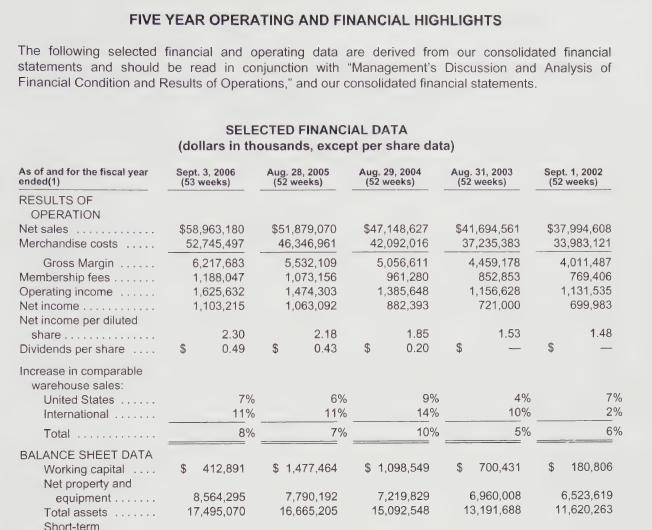
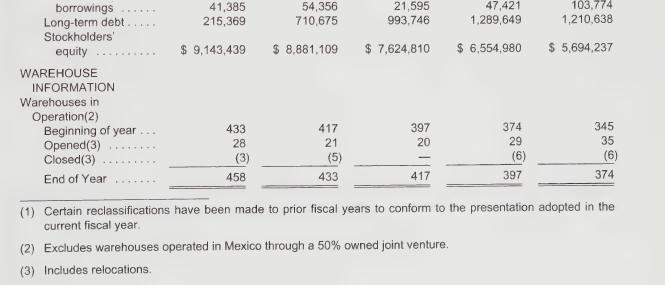
The annual reports of publicly traded companies describe some of the financial ratios presented in this chapter. Other ratios must be calculated using the information provided in the financial statements. Income statement amounts are the result of operations over an entire year or fiscal period. However, balance sheet amounts are the balance on a particular date. Therefore, when financial ratios use both an income statement amount and a balance sheet amount, the balance sheet amount is commonly expressed as an average of the amount at the beginning of the fiscal period and the amount at the end of the fiscal period. For example, average total assets would be the sum of total assets on January 1 plus total assets on December 31, divided by 2. Because the balance sheet contains only two years of information, investors rely on information in multiple-year summaries to obtain the required information. Costco's ten-year operating and financial highlights (Appendix B page B-3 in this textbook) enable readers to calculate financial ratios for several fiscal periods.
Instructions:
Identify or calculate the following financial ratios for the years 2004 to 2006 using the financial statements and the five year operating and financial highlights, as appropriate. Use amounts in thousands of dollars, except for per share data.
1. Rate earned on average total assets
2. Rate earned on average stockholders' equity
3. Diluted earnings per share
4. Price-earnings ratio (assume a market price of \($42.89\), \($49.74\) and \($57.58\) for years 2004 to 2006, respectively)
5. Working capital
6. Current ratio
7. Debt ratio
Data from Appendix B


Step by Step Answer:


