

Based on your answers to Problems 8.85 and 8.86, compare mean full-scale IQ between the exposed and
Question:
Environmental Health, Pediatrics
Refer to Figure 8.12 (p. 313) and Table 8.7 (p. 305).
Figure 8.12: Stem-and-leaf and box plots of full-scale IQ by group, El Paso Lead Study
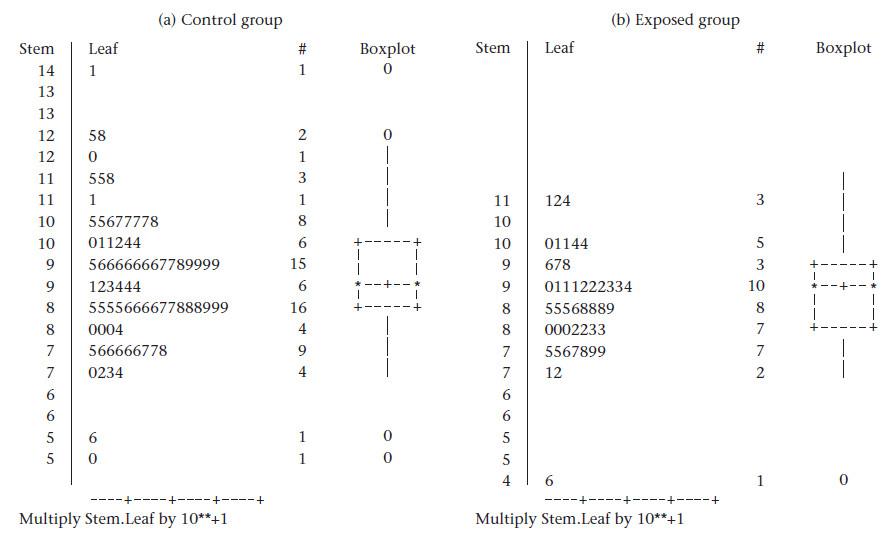
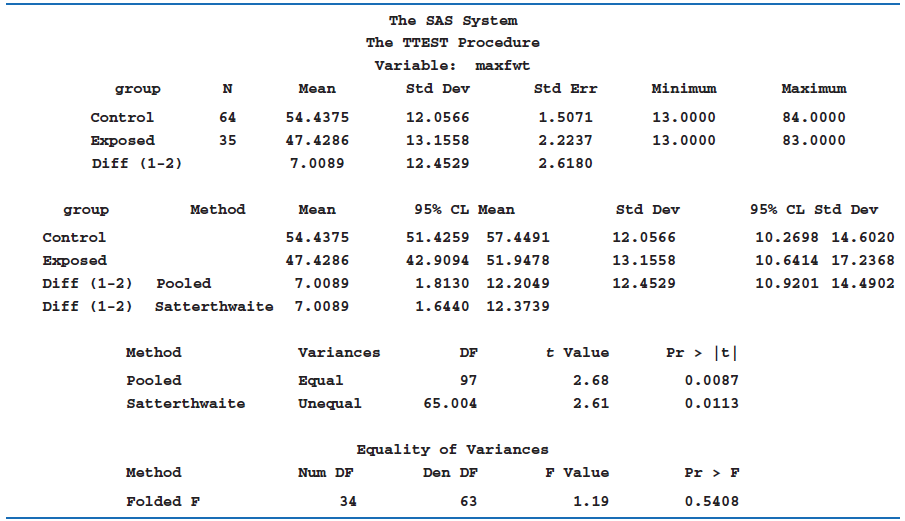
Table 8.7: Comparison of mean finger-wrist tapping scores for the exposed vs. control group using PROC TTEST of SAS
Fantastic news! We've Found the answer you've been seeking!
Step by Step Answer:
We will perform a twosample t test to compare mean IQF between exposed and cont...View the full answer

Answered By
OTIENO OBADO
I have a vast experience in teaching, mentoring and tutoring. I handle student concerns diligently and my academic background is undeniably aesthetic
3+ Reviews
10+ Question Solved
Related Book For 

Question Posted:
