Question:
Estimate the OR relating widowhood to mortality based on all the data in Table 10.27?
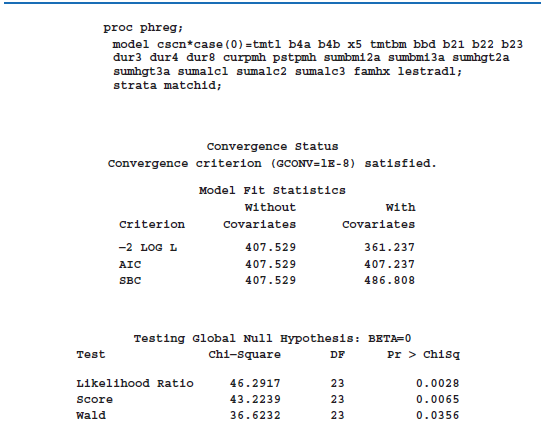
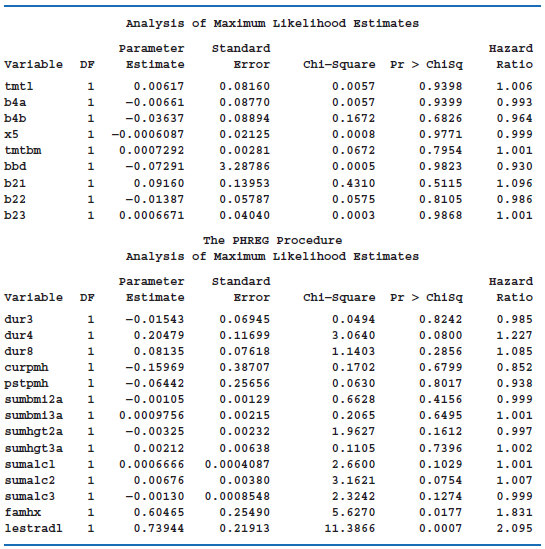
Table 13.27 Use of SAS PROC PHREG to perform conditional logistic regression on the breast cancer data


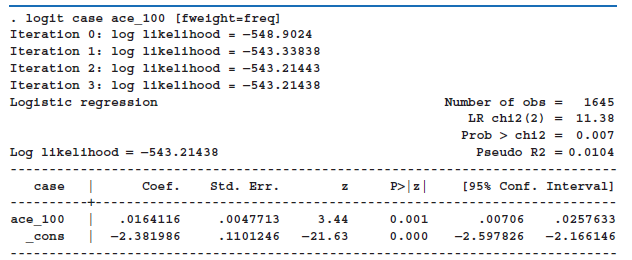
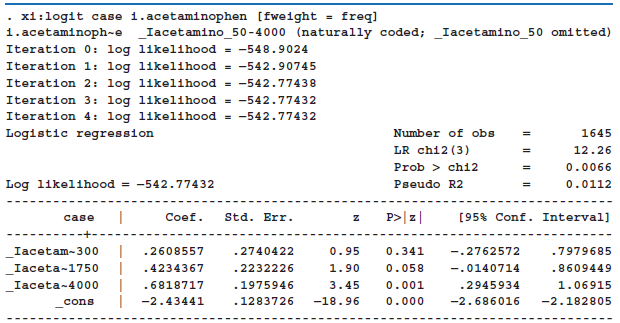
One assumption in Table 13.46 is that the log odds ratio of being a case is a linear function of the lifetime acetaminophen intake. To check this assumption, a second logistic regression was run relating disease status to acetaminophen intake in categories using the categories in Table 13.45 with Group A as the reference and Groups B, C, and D denoted by .Iacetam ~300, .Iacetam ~1750, .Iacetam ~4000, respectively (see Table 13.47).
Table 13.46: Logistic Regression relating decrease in GFR of ‰¥ 30% over 11 years vs. lifetime acetaminophen intake/100 (continuous variable)

Table 13.47: Logistic Regression relating decrease in GFR of ‰¥ 30% over 11 years vs. lifetime acetaminophen intake (categories)

Transcribed Image Text:
proc phreg; model cscn*case (0) =tmtl b4a b4b x5 tmtbm bbd b21 b22 b23 dur3 dur4 dur8 curpmh pstpmh sumbmi2a sumbmi3a sumhgt2a sumhgt3a sumalcl sumalc2 sumalc3 famhx lestradl; strata matchid; Convergence status Convergence criterion (GCONV=1E-8) satisfied. Model Fit statistics without with criterion Covariates Covariates -2 LOG L 361.237 407.529 AIC 407.529 407.237 SBC 407.529 486.808 Testing Global null Hypothesis: BETA=0 Pr > Chisq Test Chi-square DF Likelihood Ratio 46.2917 23 0.0028 0.0065 43.2239 23 Score 36.6232 23 0.0356 Wald Analysis of Maximum Likelihood Estimates Parameter standard Hazard Variable DF Estimate Error Chi-square Pr > Chisq Ratio tmtl 0.00617 0.08160 0.0057 0.9398 1.006 b4a -0.00661 0.08770 0.0057 0.9399 0.993 b4b -0.03637 0.08894 0.1672 0.6826 0.964 x5 -0.0006087 0.02125 0.0008 0.9771 0.999 tmtbm 0.0007292 0.00281 0.0672 0.7954 1.001 bbd -0.07291 3.28786 0.0005 0.9823 0.930 b21 0.09160 0.13953 0.4310 0.5115 1.096 b22 -0.01387 0.05787 0.0575 0.8105 0.986 b23 0.0006671 0.04040 0.0003 0.9868 1.001 The PHREG Procedure Analysis of Maximum Likelihood Estimates Parameter standard Hazard Variable DF Estimate Error Chi-square Pr > chisq Ratio dur3 -0.01543 0.06945 0.0494 0.8242 0.985 dur4 0.20479 0.11699 3.0640 0.0800 1.227 dur8 0.08135 0.07618 1.1403 0.2856 1.085 curpmh -0.15969 0.38707 0.1702 0.6799 0.852 pstpmh -0.06442 0.25656 0.0630 0.8017 0.938 sumbmi2a -0.00105 0.00129 0.6628 0.4156 0.999 sumbmi3a 0.0009756 0.00215 0.2065 0.6495 1.001 sumhgt2a -0.00325 0.00232 1.9627 0.1612 0.997 sumhgt3a 0.00212 0.00638 0.1105 0.7396 1.002 sumalcl 0.0006666 0.0004087 2.6600 0.1029 1.001 sumalc2 0.00676 0.00380 3.1621 0.0754 1.007 sumalc3 -0.00130 0.0008548 2.3242 0.1274 0.999 famhx 0.60465 0.25490 5.6270 0.0177 1.831 lestradl 0.73944 0.21913 11.3866 0.0007 2.095


