22 Study of contaminated fish. Refer to the U.S. Army Corps of Engineers data on fish contaminated...
Question:
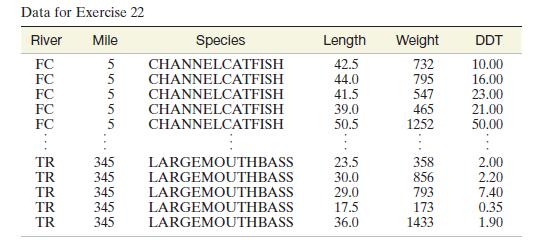
22 Study of contaminated fish. Refer to the U.S. Army Corps of Engineers data on fish contaminated from the toxic discharges of a chemical plant located on the banks of the Tennessee River in Alabama, shown below. Recall that the engineers measured the length (in centimeters), weight
(in grams), and DDT level (in parts per million) for 144 captured fish. In addition, the number of miles upstream from the river was recorded. The data are saved in the FISHDDT file. (The first and last five observations are shown in the table on the next page .)
a. Fit the first-order model E(y) = b0 + b1 x1 +
b2 x2 + b3 x3 to the data, where y = DDT level, x1 = mile, x2 = length, and x3 = weight. Report the least squares prediction equation.
b. Find the estimate of the standard deviation of e for the model, and give a practical interpretation of its value.
c. Do the data provide sufficient evidence to conclude that DDT level increases as length increases? Report the observed significance level of the test, and reach a conclusion. Use a = .05.
d. Find and interpret a 95% confidence interval for b3.
e. Test the overall adequacy of the model, using a = .05.
Step by Step Answer: