72 Ranking Ph.D. programs in economics. In to the Southern Economic Journal (Apr. 2008) rankings of Ph.D.
Question:
72 Ranking Ph.D. programs in economics. In to the Southern Economic Journal (Apr. 2008) rankings of Ph.D. programs in economics at 129 colleges and universities, the number of publications published by faculty teaching in the Ph.D.
program and the quality of the publications were used to calculate an overall productivity score for each program.
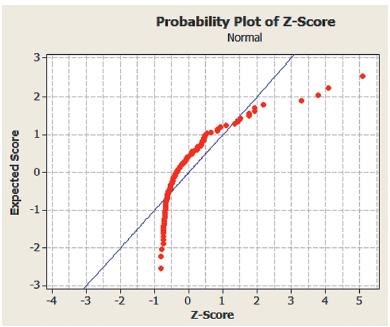
The mean and standard deviation of these 129 productivity scores were then used to compute a z -score for each economics program. The data ( z -scores) for all 129 economic programs are saved in the ECOPHD file. A MINITAB normal probability plot for the z -scores is shown in the accompanying printout.
a. Use the graph to assess whether the data are approximately normal.
b. Based on the graph, determine the nature of the skewness of the data.
Step by Step Answer:

This question has not been answered yet.
You can Ask your question!